 Marco Russo & Alberto Ferrari
When you execute a DAX query over a Tabular model with imported data, the Server Timings pane provides detailed information about the storage engine operations performed. Until version 2.16 of DAX Studio, only the Scan operations were filtered and displayed by default. However, there could be multiple storage engine operations executed within a single batch request made by the formula engine in complex models. This batch operation could be important to accurately evaluate the materialization made to the formula engine, which is more expensive than the materialization internal only to batch operations.
The Server Timings pane in DAX Studio 2.17 introduces new features related to batch storage engine operations that better address more complex scenarios.
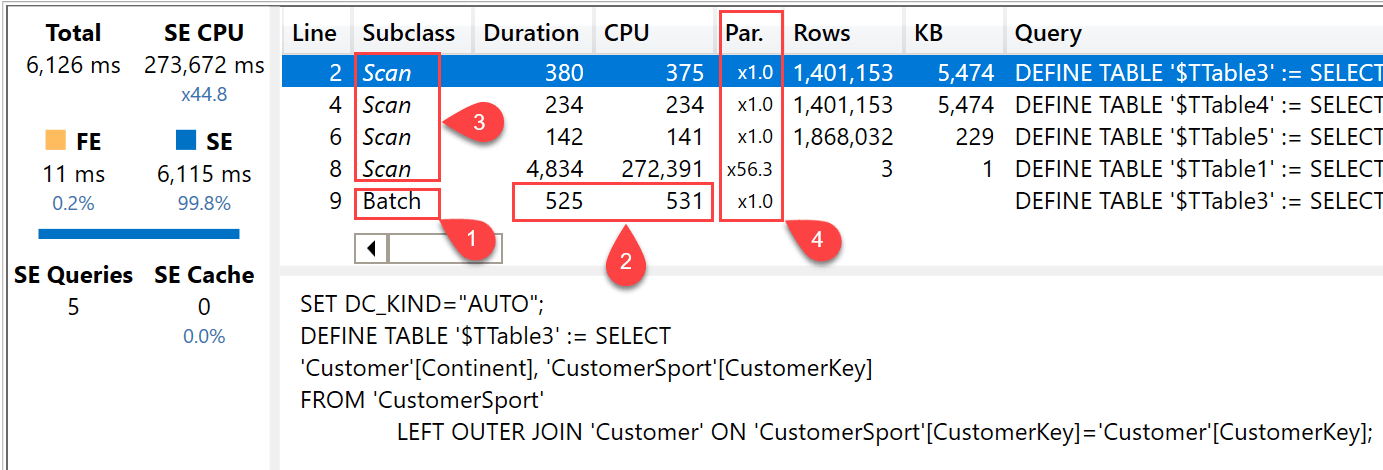
- The Batch subclass is now visible by default.
- Duration and CPU for the batch operation are now displayed as a difference between the values reported by the profiler events and the sum of the internal Scan events for that Batch.
- The Scan events that are part of a Batch are displayed in Italic:
- All the scan events in Italic before a Batch event are part of the same Batch.
- The materialization produced by the Batch to the formula engine is usually the one provided by the last Scan operation belonging to the Batch.
- The materialization produced by other Scan events of the same Batch is used only by the storage engine, and it is not copied to the formula engine.
- The column computes the parallelism indicator for each operation in the storage engine:
- The Par. column shows the ratio between CPU and Duration.
- The parallelism ratio is not computed when either Duration or CPU is 0.
The Batch operation was not displayed by default in previous versions of DAX Studio to simplify the visualization of the actual scan operations. Indeed, the Batch event includes the CPU and Duration costs of all the internal Scan events, which would be redundant in the Server Timings window. However, ignoring the Batch CPU and Duration cost had an undesired side effect on the calculation of the Formula Engine cost, which used to be computed as a difference between the total query duration and the sum of all the Scan events.
In DAX Studio 2.17 the CPU and Duration cost of the Batch event is computed as the net cost of the Batch operation, excluding the cost of the internal Scan operations already displayed in other rows of the Server Timings window. This way, the calculation of the Formula Engine cost is more accurate in complex models.
Finally, the calculation of the parallelism factor for each storage engine operation makes it easier to identify why a DAX query does not scale-out using all the available cores. This way, it is possible to identify the individual storage engine operations that are not scaling on multiple cores.