-
 article
Introducing RANKX in DAX
RANKX is a simple function used to rank a value within a list of values. Its use is simple, but it can be a source of frustration for newbies. In this article we introduce the RANKX function with a few… Read more
-
The RANKX function in Power BI might have an unexpected behavior when applied to a column that has a specific sort order in the data model. This article explains why, and how to address this issue. Read more
-
RANK is a new DAX function to rank items based on multiple columns. This article introduces the RANK function and its differences with RANKX. Read more
-
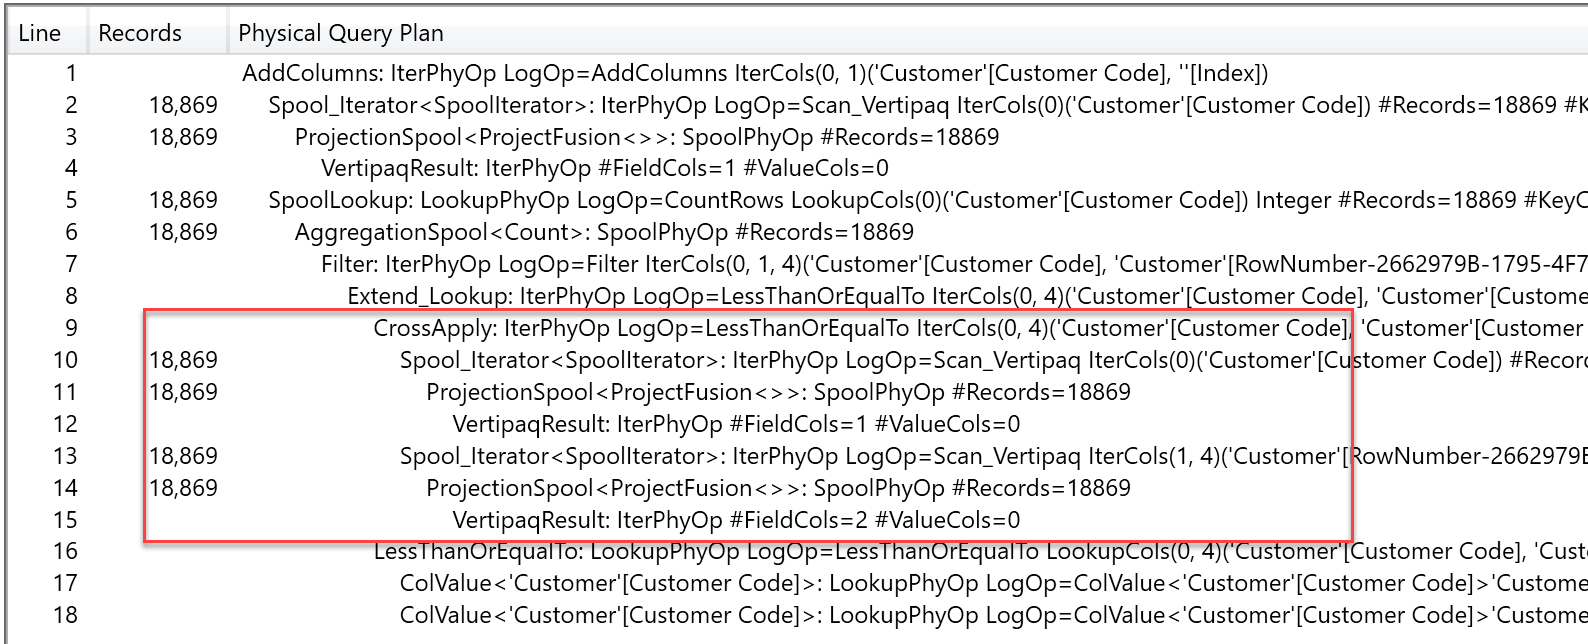
This article presents different techniques to compute a rownumber column in DAX based on a specific ranking, comparing slow and optimized approaches. Read more
-
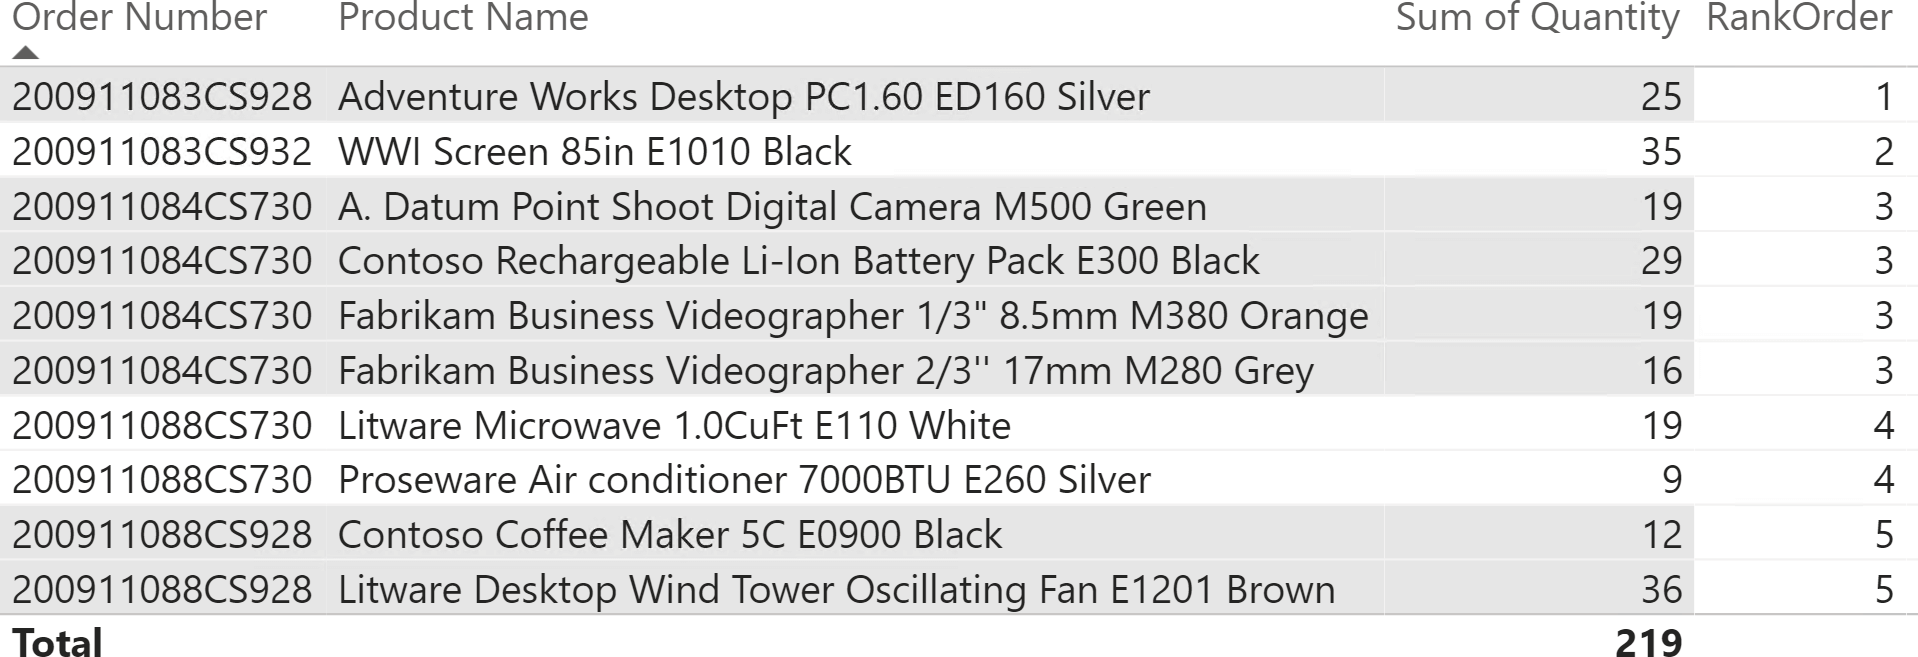
This article describes how to use conditional formatting with a DAX expression to color the rows of a table in Power BI based on the order number instead of using the alternate rows color formatting option. Read more
-
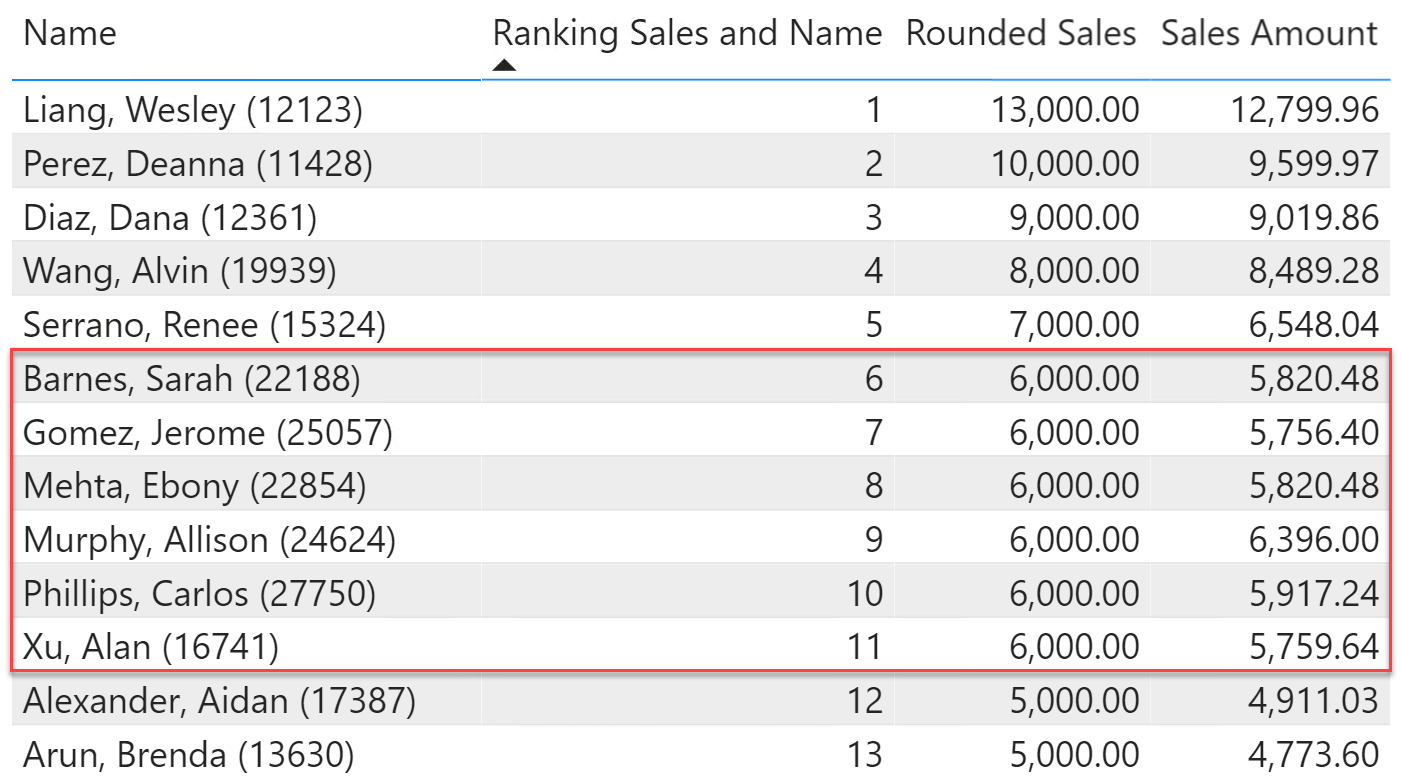
This article shows techniques to obtain a ranking based on more than one column. The ranking can be both static and dynamic. Read more
-
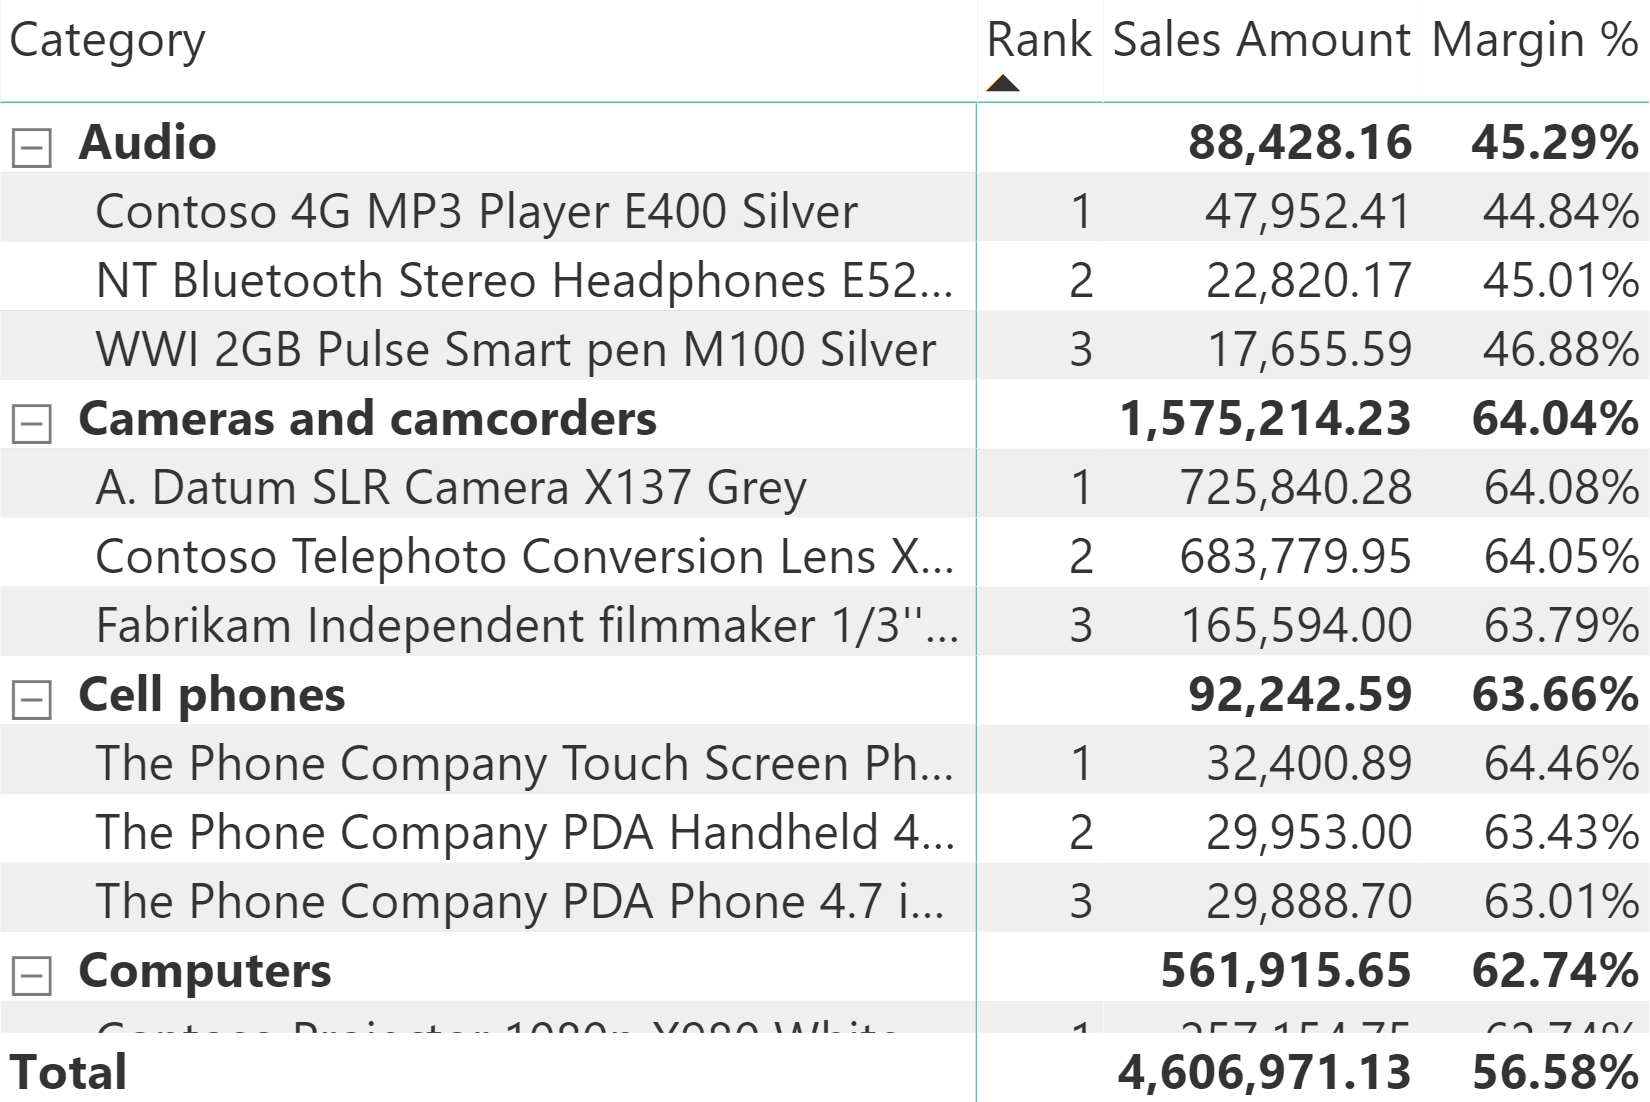
This article describes different techniques to display the first three products for each category in Power BI. It includes considerations on how to adapt the technique to different models and requirements. Read more
-
 article
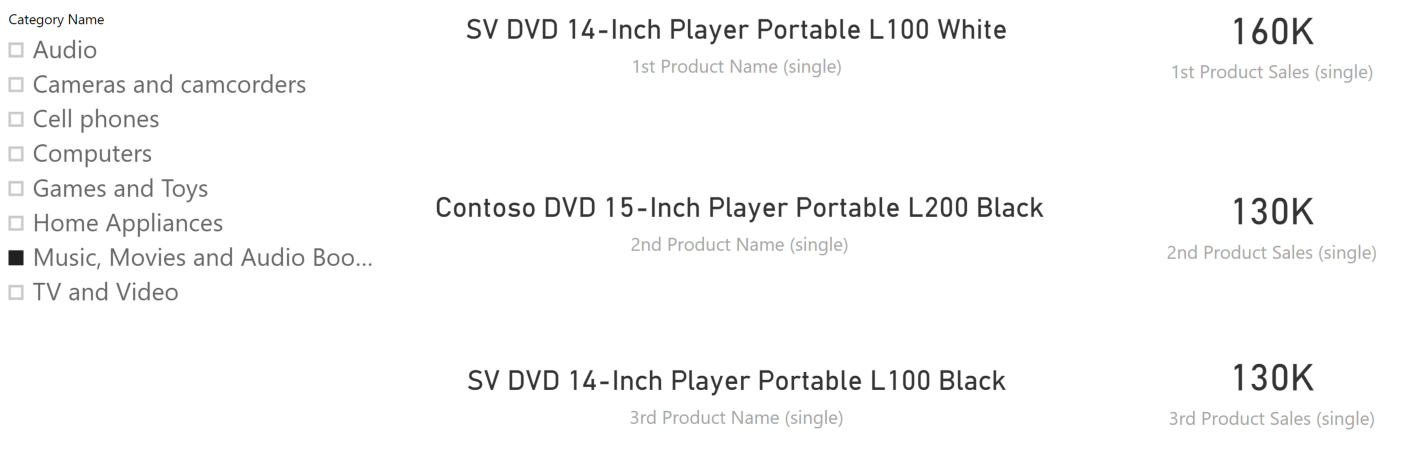
Displaying Nth Element in DAX
This article describes how to create a measure displaying the name or value of an element that has a specific ranking, with different option for managing ties. Read more
-

Rolling averages are a very common calculation used to smooth out charts. This article shows how to compute a rolling average taking into account only the working days. Read more
-
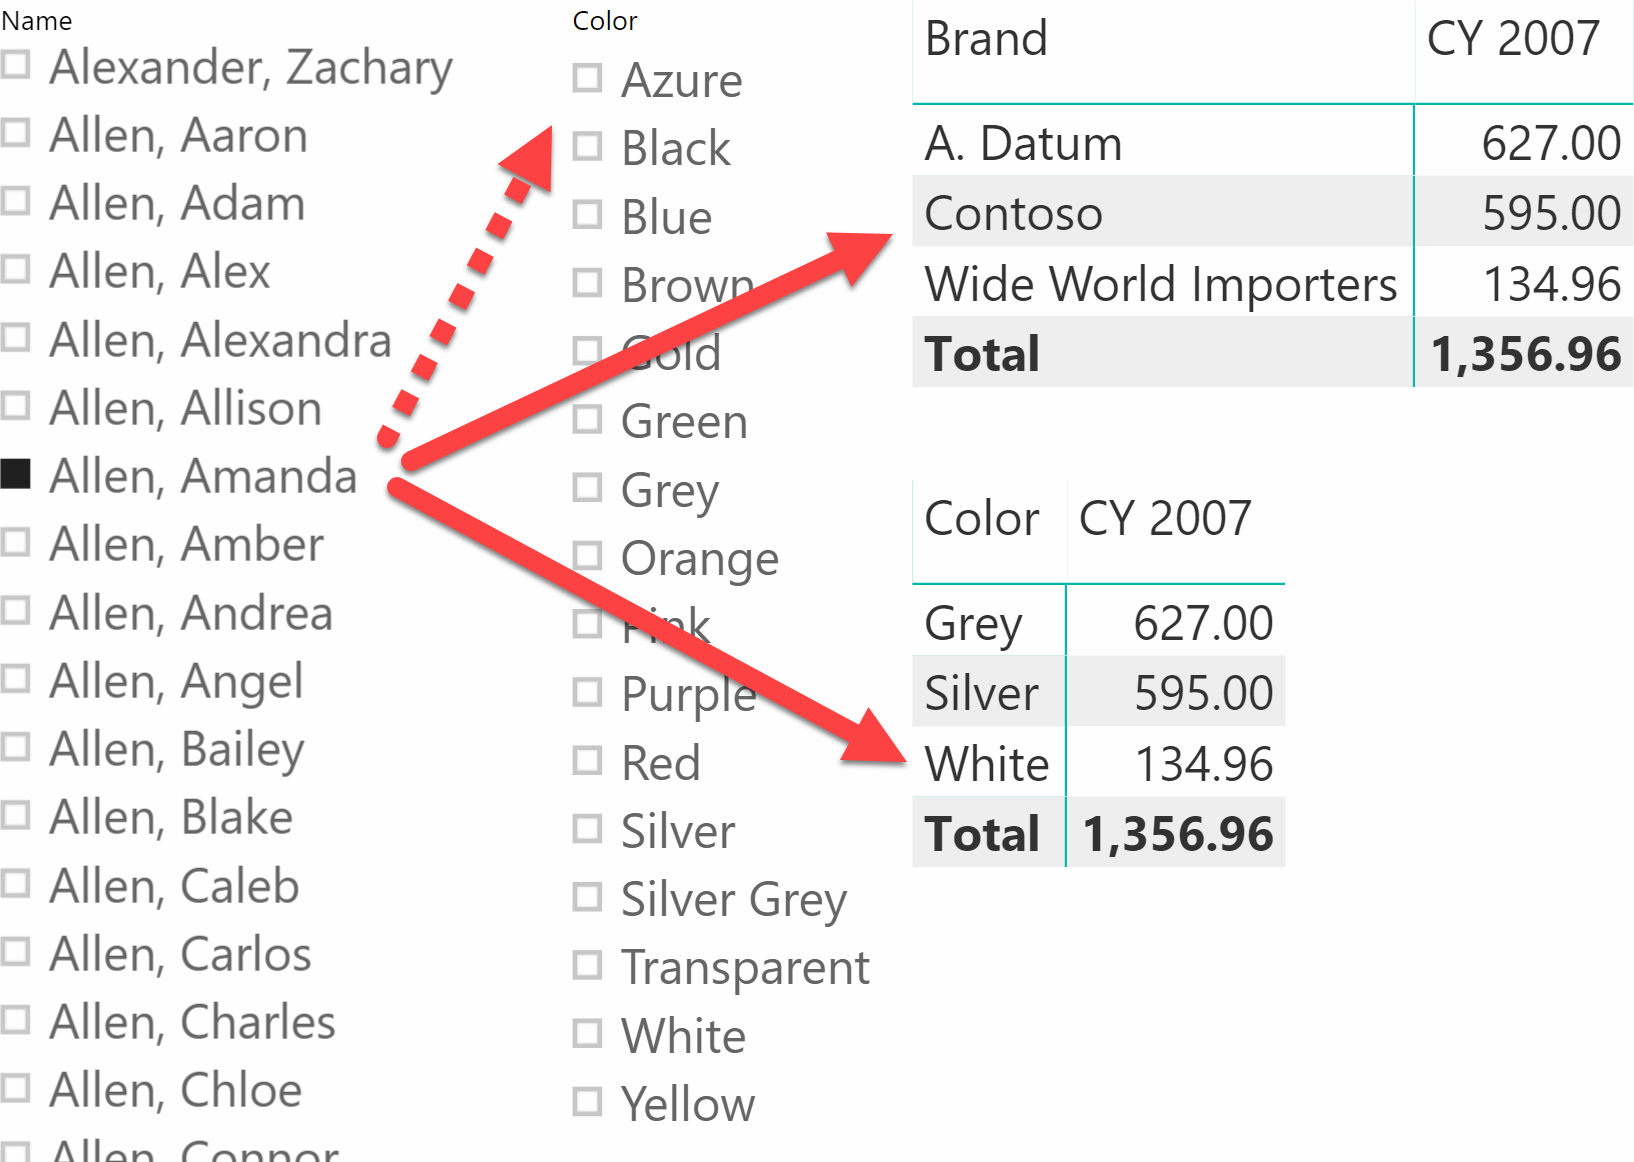
The June 2019 update of Power BI includes the ability to filter slicer items based on a measure. This article explains why this is an important feature that should replace bidirectional filters used for the same purpose. Read more