 Marco Russo
The “classical” way to manage many-to-many relationships
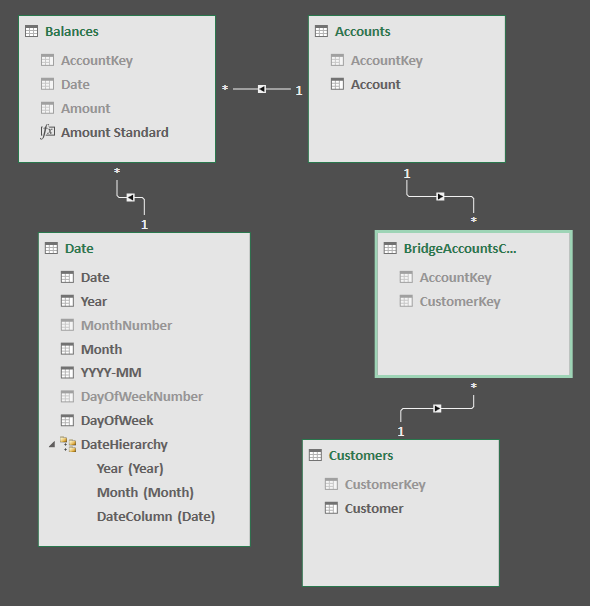
As you can read in articles and white papers, DAX always offered a syntax to manage many-to-many relationships. For example, consider the following data model, where each customer can have more accounts and each account can belong to many customers. Each row in BridgeAccountsCustomers table defines a relationship between one account and one customer.
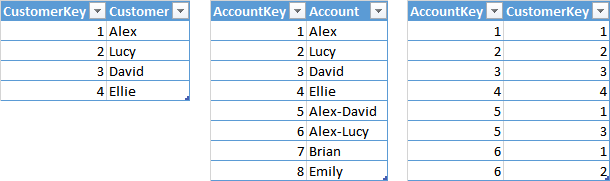
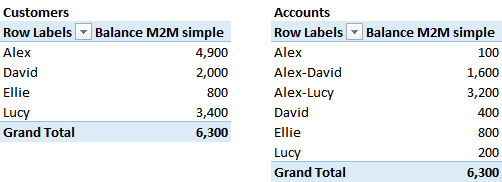
The following is the content of the Customers, BridgeAccountsCustomers, and Accounts tables.
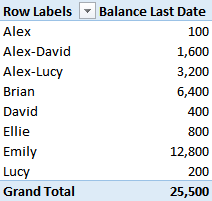
The measure “Balance” should display the value of the balance at the last day for all the accounts, assuming that the balance is available for all the accounts at a given date. This should result in the following report for the sum of account balances at the end of 2016:
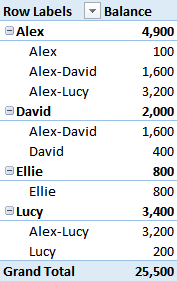
The goal is to display for every customer the value of all of the accounts, displaying this final result:
In Power Pivot for Excel 2010/2013, and in Analysis Services 2012/2014, you can write the balance measure using the following syntax, which leverages the expanded bridge table in the filter context.
Balance M2M simple :=
CALCULATE (
    [Balance Last Date],
    BridgeAccountsCustomers
)
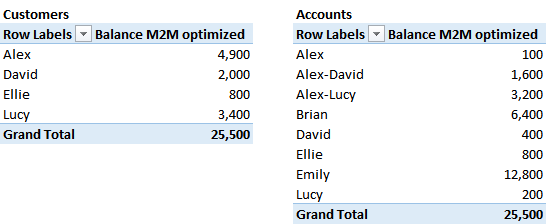
However, this formula applies the filter also when there is an account without any owner, as you can see in the following screenshot, where the accounts for Brian and Emily are not considered, even in the grand total. Hiding data of orphaned accounts could be an undesired side effect for the reports.
In order to apply the filter only when there is a selection of one or more customers, you have to duplicate the code, because we do not have a conditional table function.
Balance M2M optimized:=IF (
    ISCROSSFILTERED ( Customers[CustomerKey] ),
    CALCULATE ( [Balance Last Date], BridgeAccountsCustomers ),
    [Balance Last Date]
)
Using this measure, the accounts of Brian and Emily are visible in the grand total and in the details of the accounts, even if they are not displayed for any customer.
Applying the filter to handle the many-to-many relationship even when it is not required involves an additional cost, which can be avoided using this last version of the Balance measure. However, the code becomes more complex and we might want to find a better way to manage that.
The “new” way using bidirectional filters
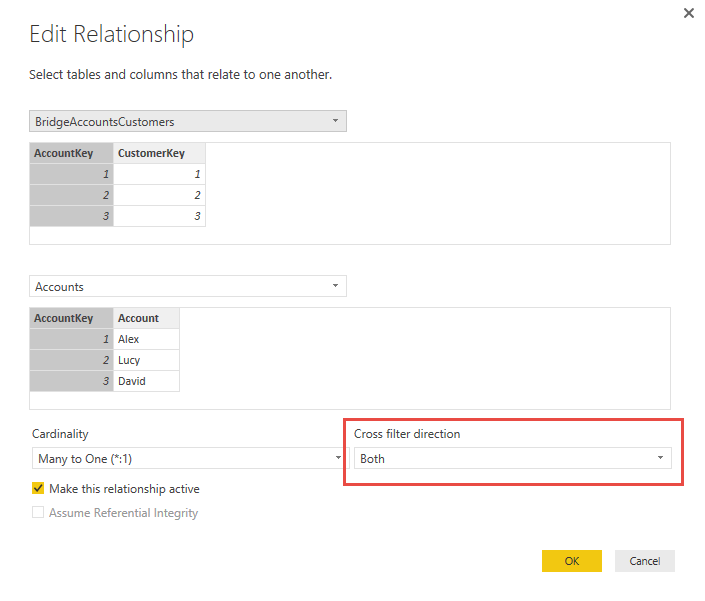
In Power BI Desktop and in Analysis Services 2016, we have an excellent solution to this problem. By enabling a bidirectional filter (Exact description from dialog box) between the BridgeAccountsCustomers and Accounts tables, all the measures receive the filter context from the bridge table in case one or more customers are selected. If there are no active filters on customers, which means that you see the value for all the customers, the filter is not applied at all to the accounts. Therefore, you pay the price of the filter propagation through a bidirectional filter only when this is really required, and this does not require any single line of DAX in your measures.
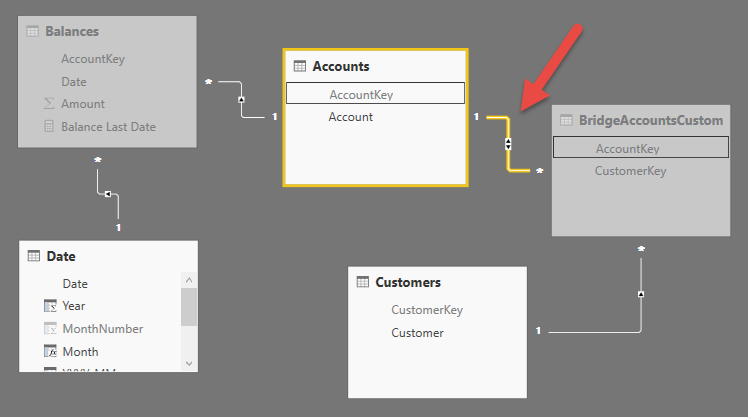
The following picture shows the configuration of the relationships in Power BI and the detail of the bidirectional filter active in the relationship between BridgeAccountsCustomers and Account.
This solution is not available in Excel 2016, because you cannot set a bidirectional filter on a relationship in the data model. However, the DAX engine in Excel 2016 has the same capabilities of Power BI in terms of bidirectional propagation of the filters, but we have to write a line of DAX code to use it.
The function CROSSFILTER is new in Excel 2016, Power BI, and Analysis Services 2016. It provides the ability to modify the direction of propagation of the filter in a relationship. You can use the following arguments: None, OneWay, Both. For our purposes, we can use BOTH on the relationship between BridgeAccountsCustomers and Account, obtaining the same effect of the bidirectional filter set in the data model.
Balance M2M 2016:=
CALCULATE (
    [Balance Last Date],
    CROSSFILTER ( BridgeAccountsCustomers[AccountKey], Accounts[AccountKey], Both )
)
As with previous versions of Excel, we still have to write this filter in CALCULATE for each measure interested in a many-to-many relationship, but using CROSSFILTER you get the same behavior of the optimized measure you have seen for Excel 2010/3, which required a test calling ISCROSSFILTERED in order to apply the many-to-many filter only if necessary.
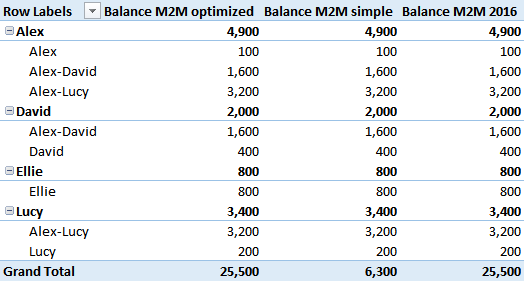
You can see in the next screenshot that the last measure (Balance M2M 2016) produces the same result of Balance M2M optimized we wrote for Excel 2013 compatibility.
Conclusion
Leveraging bidirectional filters to implement many-to-many relationships is the best approach in order to obtain the correct results and the best performance with the simplest DAX code. You can set bidirectional filters in the data model in Power BI Desktop and Analysis Services 2016. This is not possible in Excel 2016 at the data model level, but you can leverage on the CROSSFILTER function in Excel 2016, obtaining the same performance with a minimal impact on DAX code.
Specifies cross filtering direction to be used in the evaluation of a DAX expression. The relationship is defined by naming, as arguments, the two columns that serve as endpoints.
CROSSFILTER ( <LeftColumnName>, <RightColumnName>, <CrossFilterType> )
Evaluates an expression in a context modified by filters.
CALCULATE ( <Expression> [, <Filter> [, <Filter> [, … ] ] ] )
Returns true when the specified table or column is crossfiltered.
ISCROSSFILTERED ( <TableNameOrColumnName> )