 Marco Russo & Alberto Ferrari
A common challenge in Power BI reporting is how to display several pieces of information about a single item (such as sales transactions, product details, or customer details) without dedicating a separate column to each attribute. Using individual columns for each detail can consume space, especially for fields that are often empty. This article explores techniques to consolidate multiple fields from a business entity or transaction into a single column in a matrix visual, thus presenting transaction details in a space-efficient way.
Dealing with multiple columns
Presenting detailed information about a business entity often requires displaying values from multiple columns, which can take up too much space in Power BI reports and make them harder to read. Indeed, a consequence of there being too many columns is that we now have to use a horizontal scrollbar. So instead of using a separate column for each detail, it would be better to combine relevant fields and show them together in a single column, especially in a matrix visual. This section introduces the challenge and presents approaches to representing multiple attributes more efficiently, thus leading to advanced solutions using DAX measures in the next sections.
Including multiple columns in a table
To display transaction details across multiple columns in a table, we could create a separate table visual that shows the relevant fields for the selected item. This table must be synchronized with the matrix visual, typically by selecting an order number or unique identifier in the matrix, which then filters the table to display the associated details. In this example, the Order Number selection displays the customer details in a separate table.
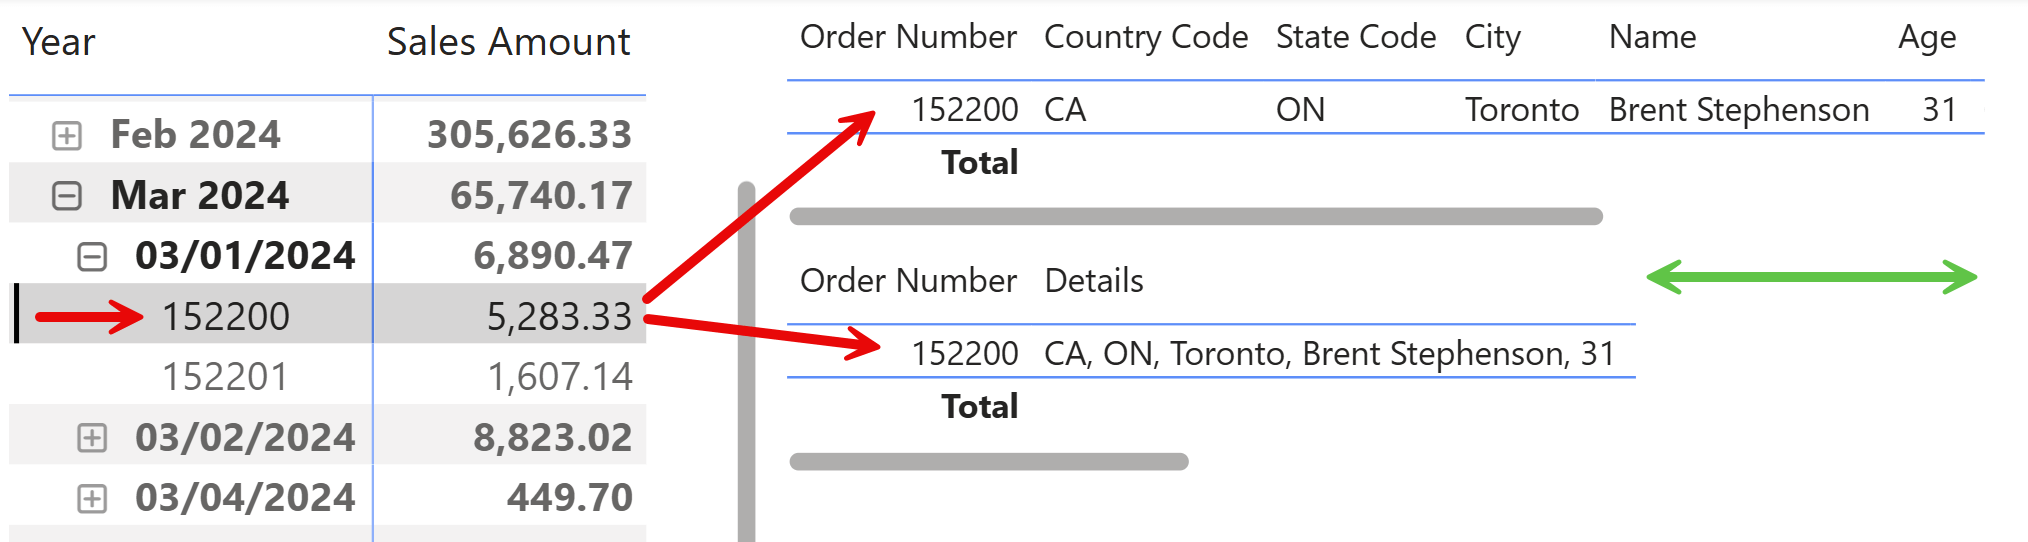
While this approach enables you to show all the details, it consumes additional space on the report canvas because you need both the matrix and the table visual. To partially address the space issue, we created a visual calculation that collapses multiple columns into a single Details column. This Details column can display concatenated information from several fields, which saves space (as illustrated by the green arrow). However, this solution comes with limitations: the synchronization between the matrix and the table is manual, and it requires users to click on the desired item in the matrix. Additionally, the columns used in the visual calculation cannot be hidden in the table; the common workaround is to set their width to 0, but this is not ideal, and in general, it is not a fully-integrated solution within the matrix visual because it requires a separate visual.
Including multiple columns in a matrix
Including multiple detail columns in a matrix visual adds hierarchical levels, making navigation difficult and potentially hurting query performance. The layout can also become unclear, as shown when several customer attributes appear under the order number (152200 in this example).
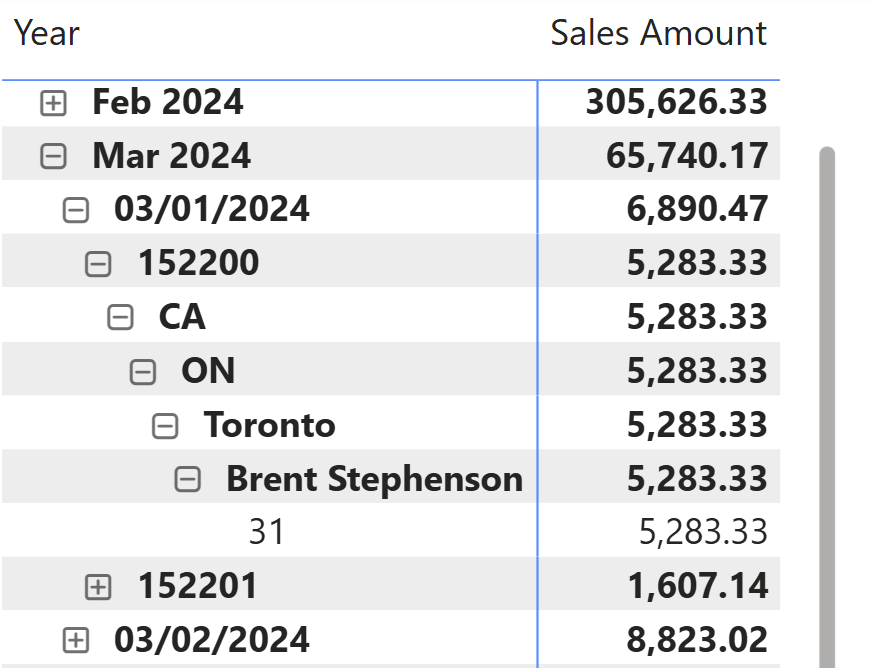
Just adding columns to the matrix is not the way to go.
Collecting data in a measure
When presenting a unique business identifier, such as a Product Code, Customer Code, or Order Number, you may want to show extra details in a Details column that, in reality, is a measure appearing after other measures in the matrix. This allows you to display transaction information directly, which eliminates the need for additional drill-down actions. Here is an example of what we want to obtain.
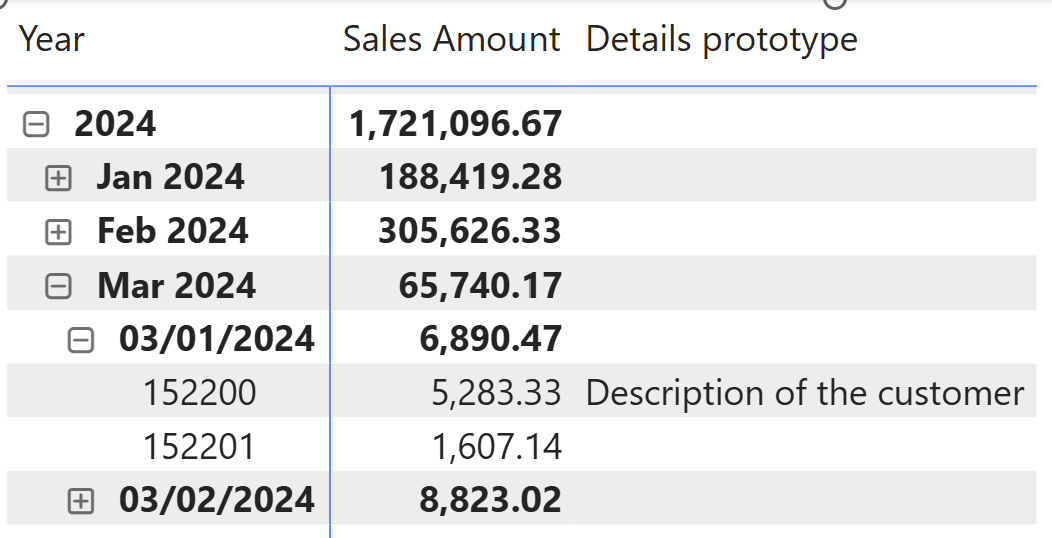
To create this example, we defined a prototype measure to validate the design:
Details prototype =
IF (
    SELECTEDVALUE ( Sales[Order Number] ) = 152200,
    "Description of the customer"
)
The Details prototype measure displays a fixed string when a specific order is selected. However, a measure can navigate the internal structure of the model to retrieve the required data. There are multiple possible approaches, because we can obtain the same result with different techniques. The goal of the article is to present several of these techniques, along with considerations regarding the performance and maintainability of the solution.
If you are interested in using the best solution, just skip to the final section. However, it is worth spending time learning the pros and cons of different approaches, because there is always a chance that you encounter scenarios where one of the other alternatives is better for you.
Details measure – version 0
This section is purely educational and shows how to explore the individual features we will use in the following complete implementations. The first measure we implement displays the currency and exchange rate for the transaction, all of which are available in the Sales table:
Details v0.A =
VAR CurrencyCode = SELECTEDVALUE ( Sales[Currency Code] )
VAR ExchangeRate = SELECTEDVALUE ( Sales[Exchange Rate] )
RETURN
    IF (
        NOT ISBLANK ( CurrencyCode ),
        CurrencyCode & "/USD=" & ExchangeRate
    )
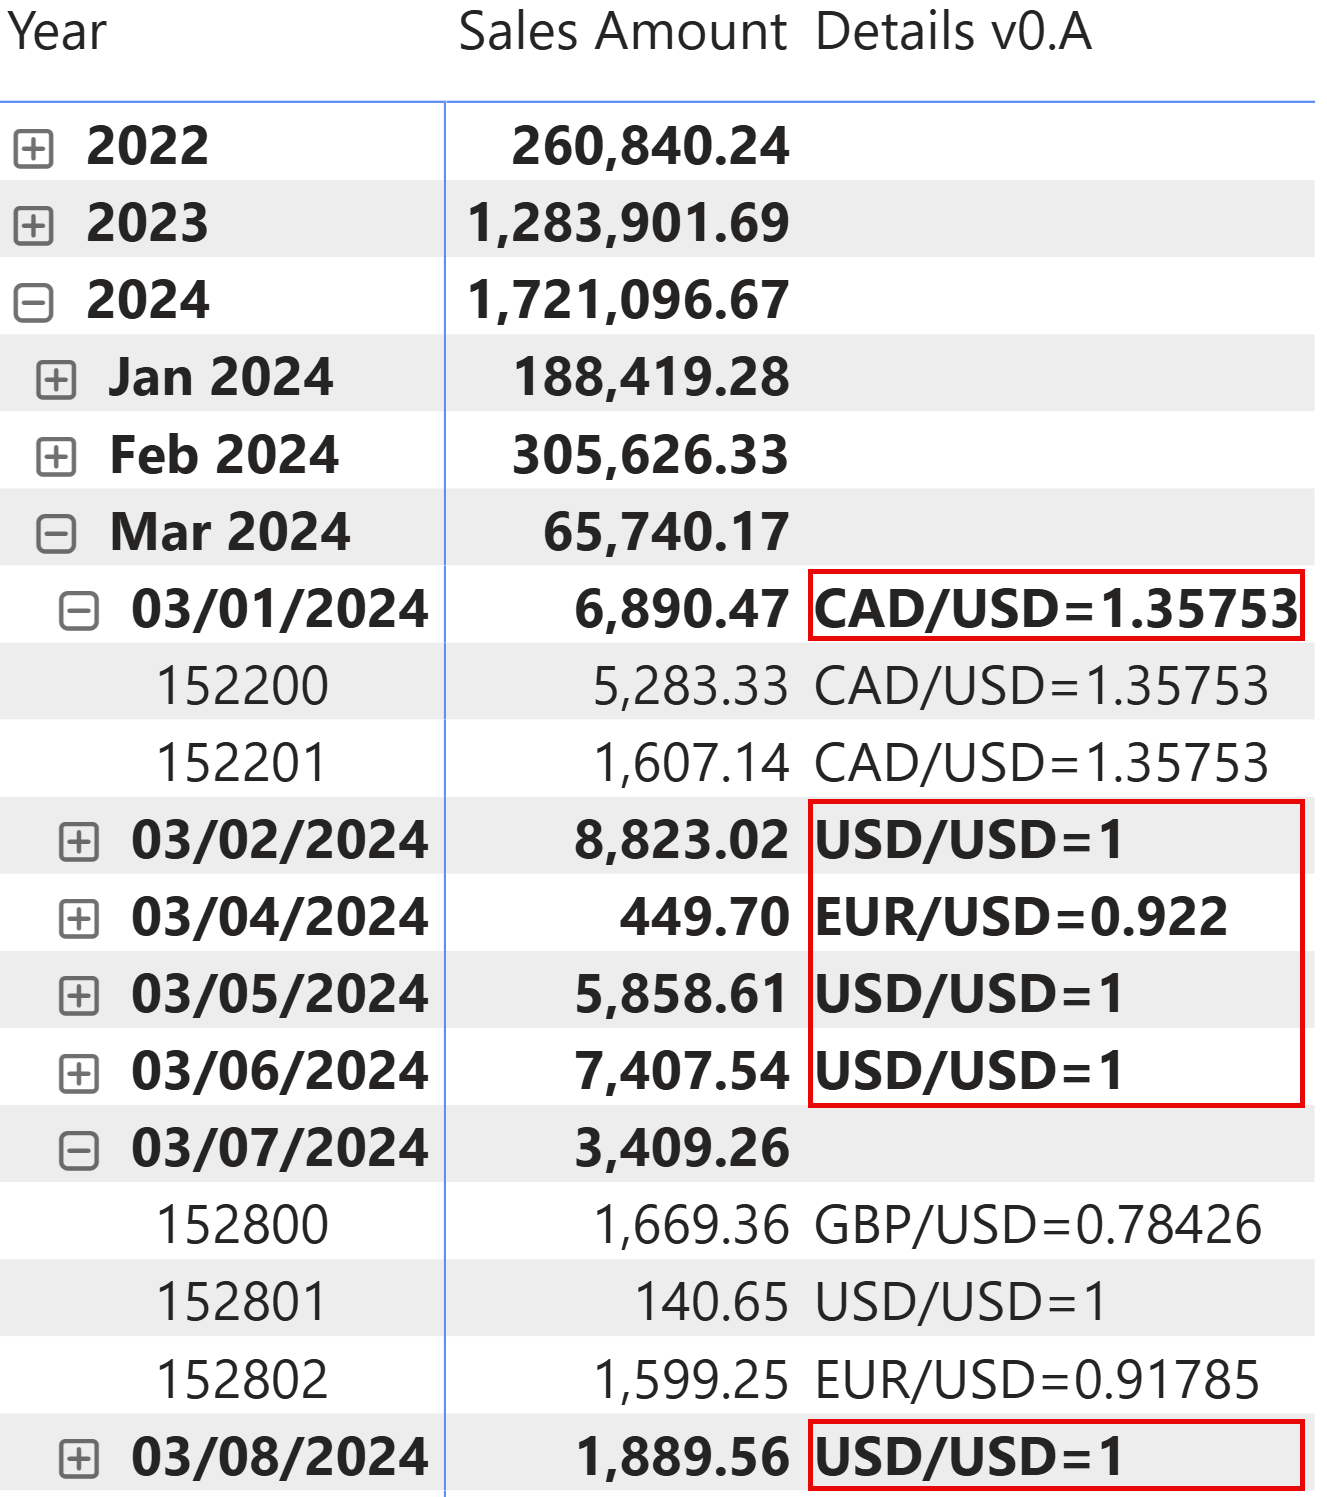
The first issue to address is that the information is also visible when multiple orders share the same currency code. This can be solved by ensuring that only one order is visible: using ISINSCOPE guarantees that the Order Number is also displayed in the matrix visual, not just filtered outside of the visual. By checking that there is a row visible in Sales, we can also use VALUES instead of the more expensive SELECTEDVALUE, which relies on an underlying DISTINCTCOUNT:
Details v0.B =
IF (
    ISINSCOPE ( Sales[Order Number] ) && NOT ISEMPTY ( Sales ),
    VAR CurrencyCode = VALUES ( Sales[Currency Code] )
    VAR ExchangeRate = VALUES ( Sales[Exchange Rate] )
    RETURN CurrencyCode & "/USD=" & ExchangeRate
)
The second issue is that adding columns requires writing a much longer expression, which would become more complex if we wanted to filter out blank values and to avoid displaying separators in the result when there is no value. For example, we should write something like that to ensure that both Currency Code and Exchange Rate are available:
Details v0.C =
IF (
    ISINSCOPE ( Sales[Order Number] ) && NOT ISEMPTY ( Sales ),
    VAR CurrencyCode = VALUES ( Sales[Currency Code] )
    VAR ExchangeRate = VALUES ( Sales[Exchange Rate] )
    RETURN
        IF (
            NOT ISBLANK ( CurrencyCode ) && NOT ISBLANK ( ExchangeRate ),
            CurrencyCode & "/USD=" & ExchangeRate
        )
)
However, with more columns to display, the code to write and maintain would be much longer. To simplify that, we could look for an approach that just provides a list of displayed values, with a standard separator between them, to obtain the following result.
The code uses a list of values in a table constructor, which CONCATENATEX iterates over to produce the output string. FILTER makes sure to remove empty values, so that the measure returns BLANK if the list is empty (without the filter, we would always have a list of two blank values):
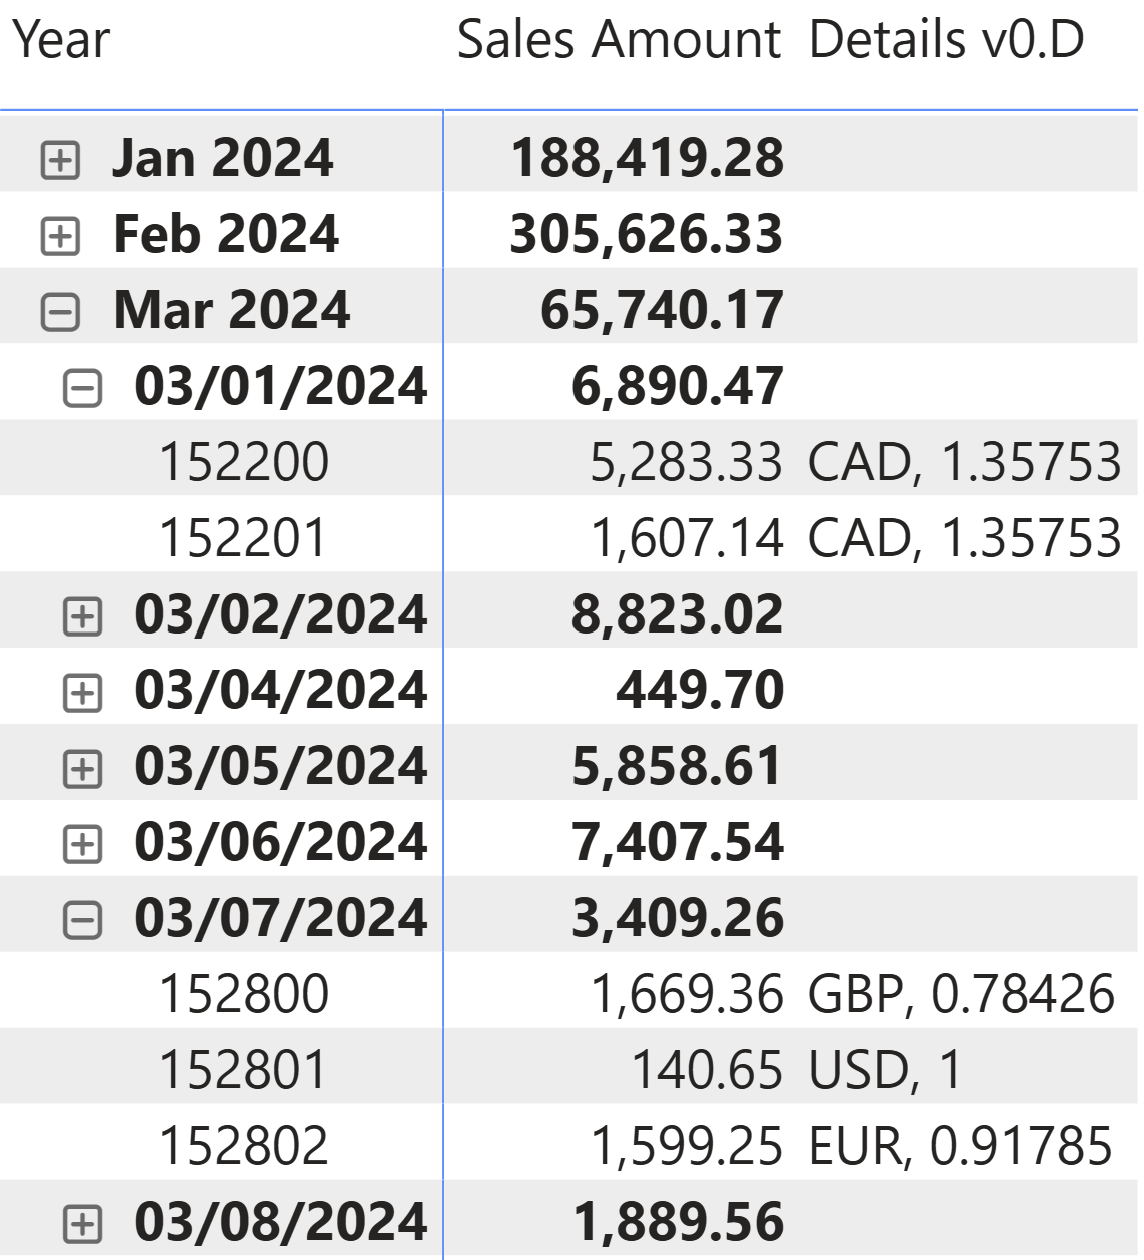
Details v0.D =
IF (
    ISINSCOPE ( Sales[Order Number] ),
    CONCATENATEX (
        FILTER (
            {
                VALUES ( Sales[Currency Code] ),
                VALUES ( Sales[Exchange Rate] )
            },
            [Value] <> ""
        ),
        [Value],
        ", "
    )
)
Details measure – version 1
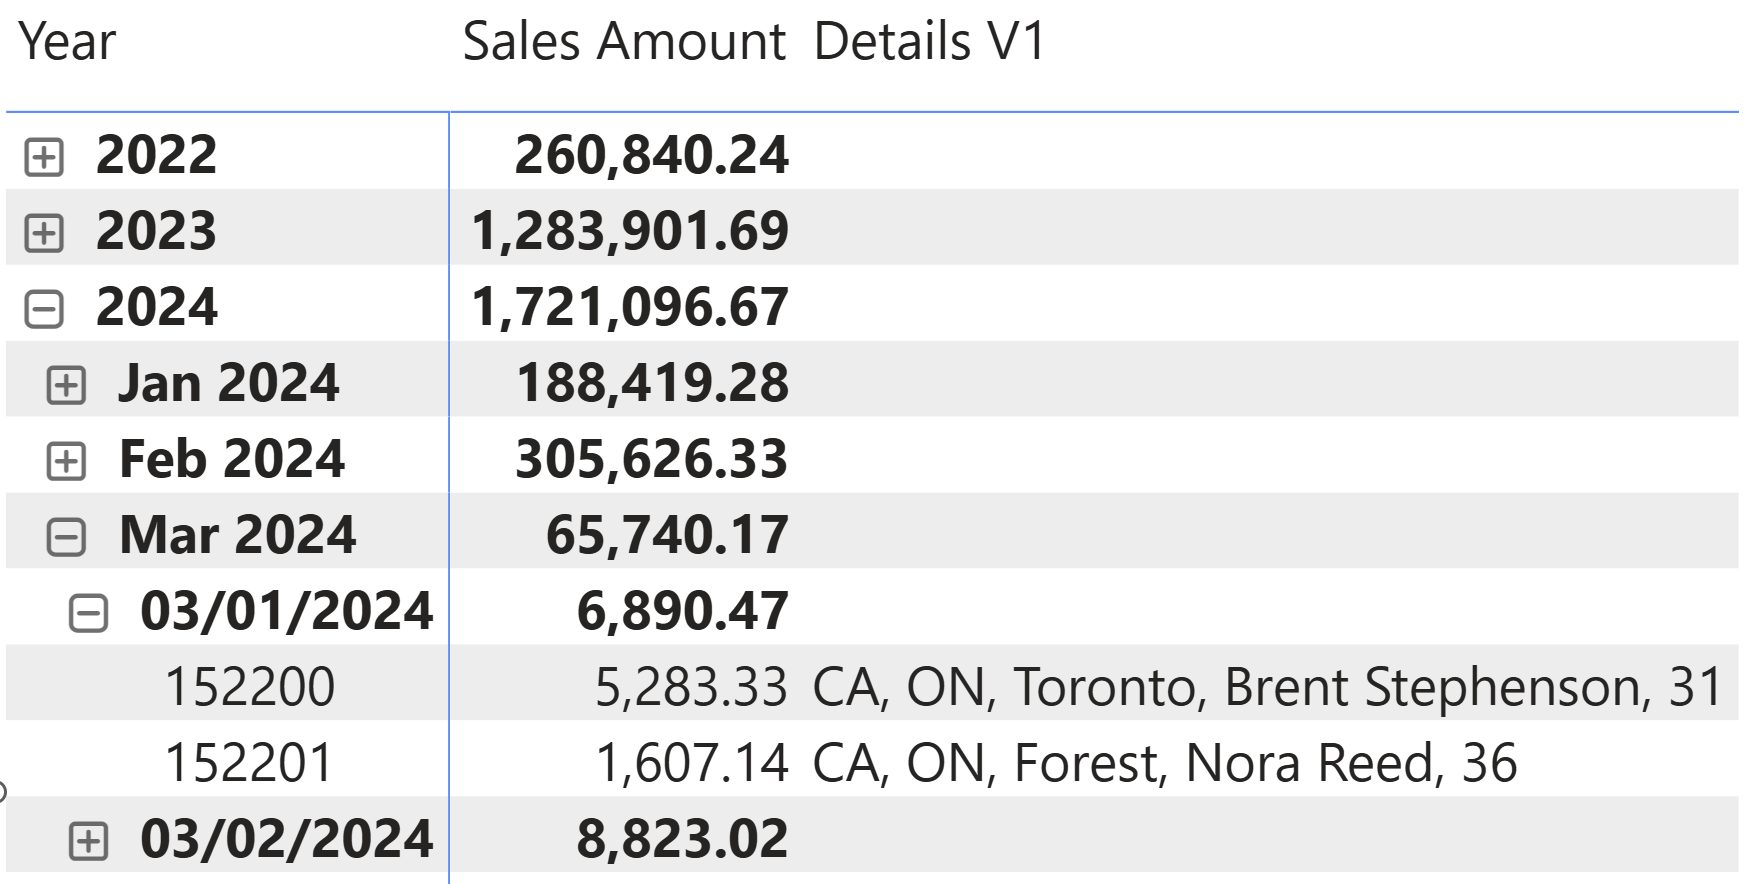
Having introduced the method of iterating over a list of values utilizing CONCATENATEX and FILTER, we can now tackle the subsequent challenge: presenting data from various tables, for instance, the Customer table.
To use the same approach as what we introduced in the previous example, we must propagate the filter from Sales to Customer; this is because the filter context only filters one order, but not the related customer. We can wrap the CONCATENATEX expression in a CALCULATE function where CROSSFILTER enables the filter propagation from Sales to Customer:
Details V1 =
IF (
    ISINSCOPE ( Sales[Order Number] ),
    CALCULATE (
        CONCATENATEX (
            FILTER (
                {
                    VALUES ( Customer[Country Code] ),
                    VALUES ( Customer[State Code] ),
                    VALUES ( Customer[City] ),
                    VALUES ( Customer[Name] ),
                    VALUES ( Customer[Age] )
                },
                [Value] <> ""
            ),
            [Value],
            ", "
        ),
        CROSSFILTER ( Sales[CustomerKey], Customer[CustomerKey], BOTH )
    )
)
The result shows customer information for each order.
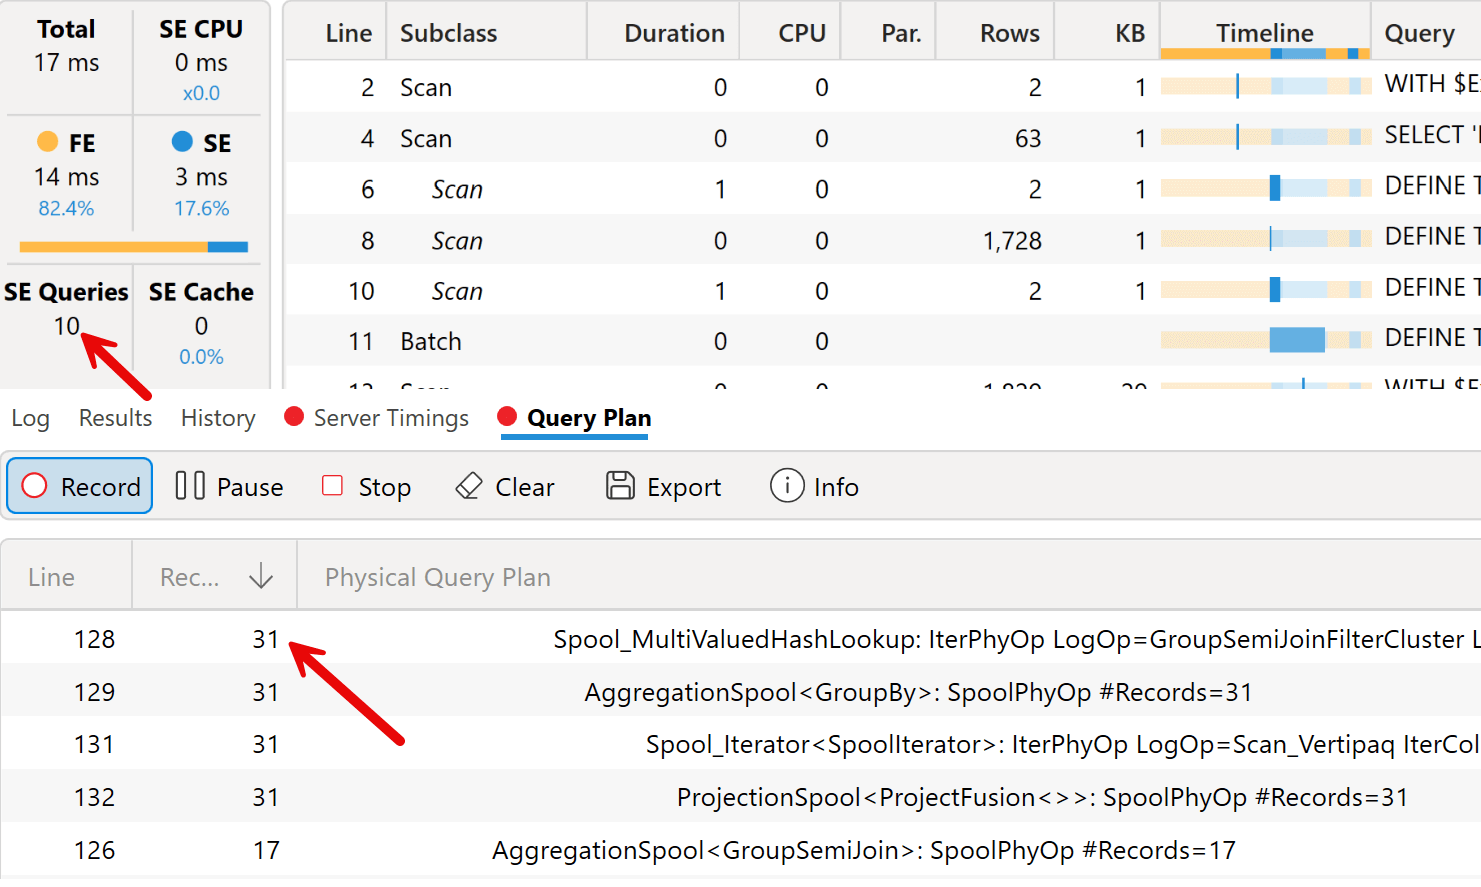
A quick look at the query plan shows that this approach generates 27 storage engine queries, with a maximum of 1,681 rows processed by the formula engine. The execution time is completely irrelevant for this amount of data; it is more interesting to consider that the physical query plan has 254 rows (not displayed in the screenshot), which is another indicator of the query plan’s complexity.
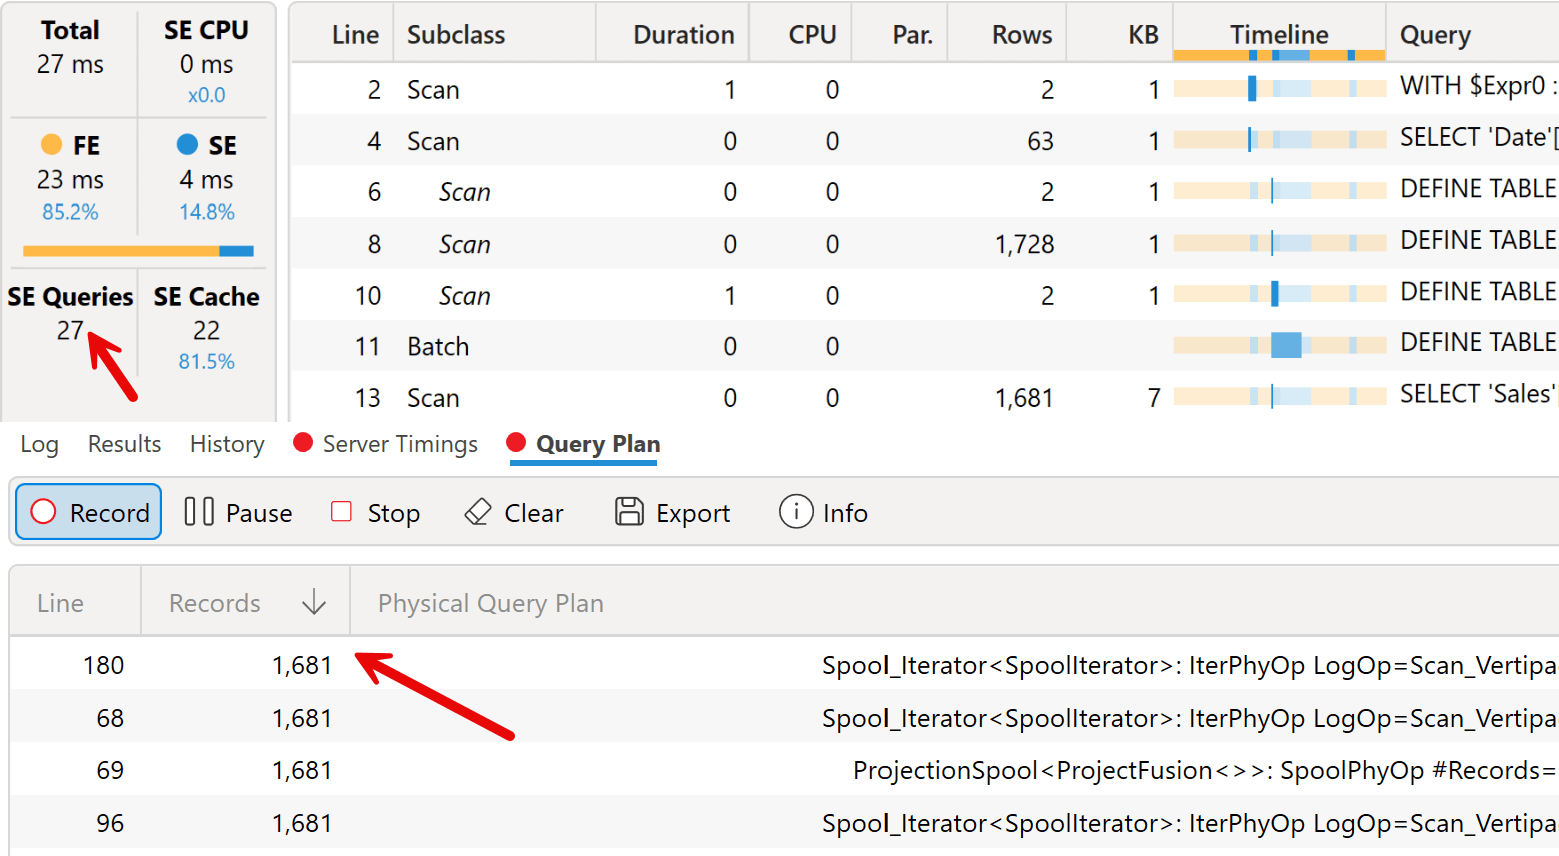
We will compare these metrics with other approaches in the following measure to evaluate the more efficient approach in terms of execution time, even though we want to balance the complexity of the code to write and maintain.
Details measure – version 2
One issue with using VALUES for each column to display is that the code is verbose. The syntax is simpler (and potentially more efficient) when accessing column values in a row context. In the first complete solution, we create an external row context to access the rows in the required table (Customer or Sales, hopefully only one row!) and we iterate the column values with the inner iterator. In the following measure, an external CONCATENATEX iterates the Customer table, so that the inner CONCATENATEX iterates the values obtained by using simple column references:
Details V2.A =
IF (
    ISINSCOPE ( Sales[Order Number] ),
    CONCATENATEX (
        CALCULATETABLE (
            Customer,
            CROSSFILTER ( Sales[CustomerKey], Customer[CustomerKey], BOTH )
        ),
        CONCATENATEX (
            FILTER (
                {
                    Customer[Country Code],
                    Customer[State Code],
                    Customer[City],
                    Customer[Name],
                    Customer[Age]
                },
                [Value] <> ""
            ),
            [Value],
            ", "
        ),
        " - " // This should never be used as long
              // as ISINSCOPE ( Sales[Order Number] ) is True
    )
)
Because the Customer table must be filtered to return only the row corresponding to the selected order, we use CALCULATETABLE and CROSSFILTER to propagate the filter from Sales to Customer. Because we know a filter is active on Sales (thanks to the initial ISINSCOPE), we can be confident that only one customer is filtered, even if the order has multiple rows in Sales.
The outer CONCATENATEX should only iterate one row in Customer. Therefore, the “ – “ separator should never be used. The result of the Details V2.A measure is identical to Details V1.
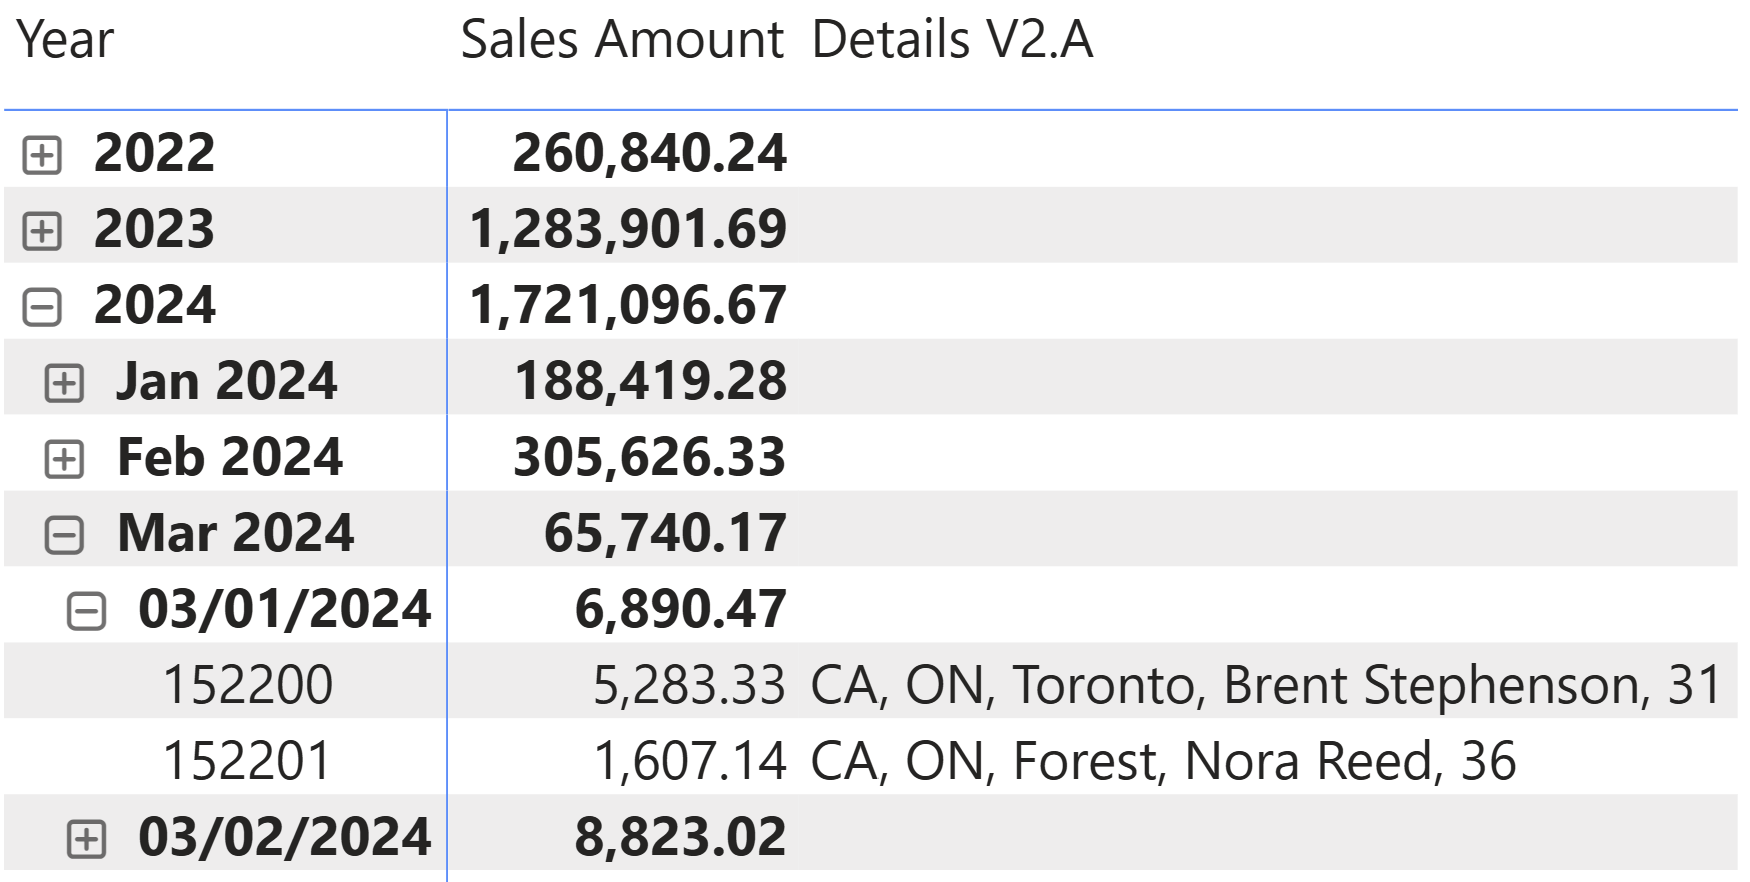
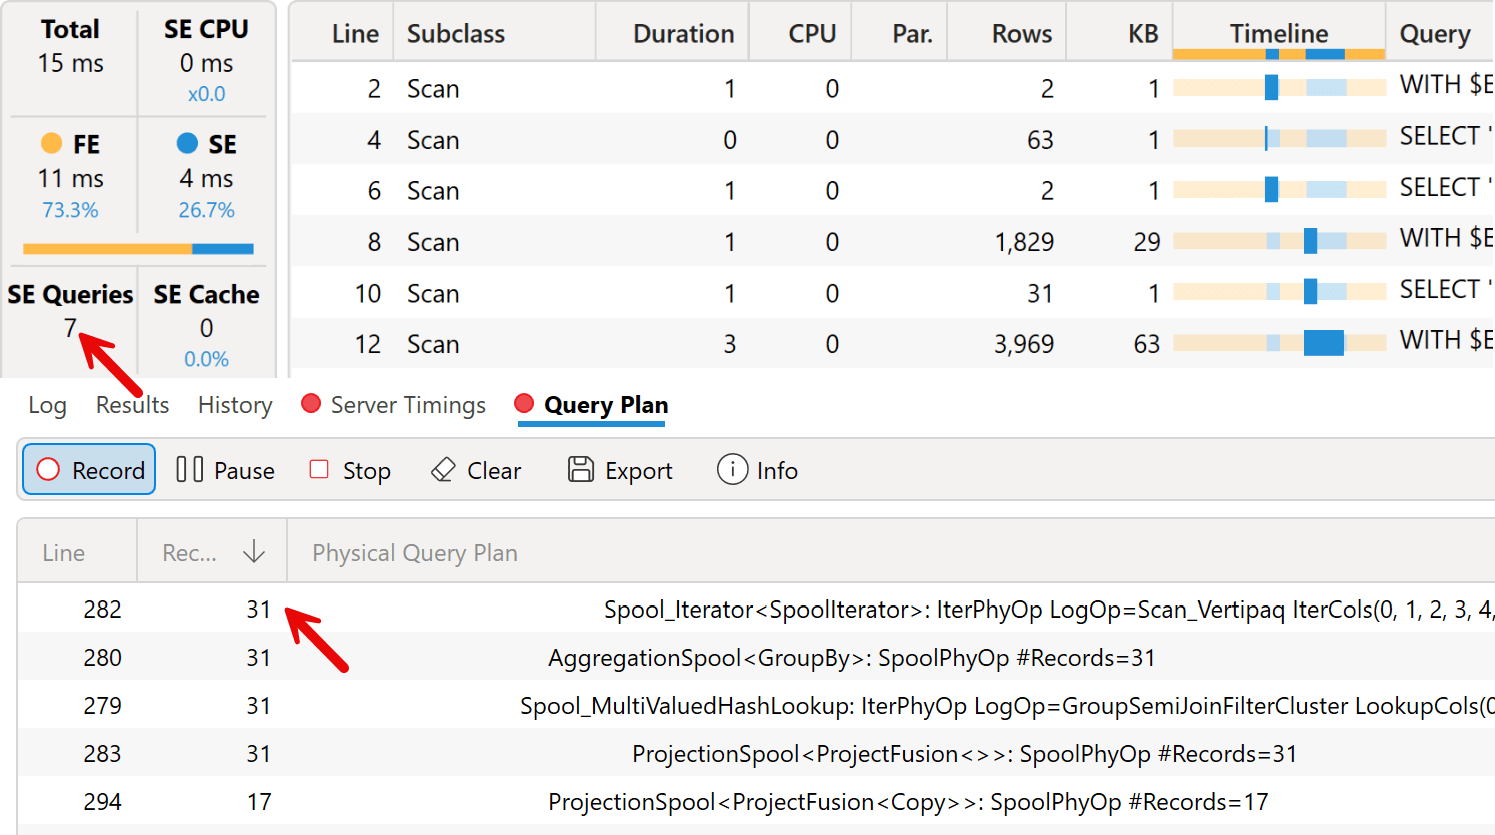
From a performance point of view, this approach reduces the number of storage engine queries (10 instead of 27), the number of rows in the physical execution plan (186 instead of 251), and the maximum number of rows iterated by the formula engine (31 instead of 1,681).
Despite the nested iterators, this approach should be faster because we only iterate over one row of the outer iterator. More importantly, this approach is the best for maintenance, as it requires only a simple list of columns to achieve the required results. Later, we will see that this simplest approach also makes it possible to move most of the code into a user-defined function (UDF).
Given the requirements, we wanted to get the details for the entire order. However, if the requirement concerned the details of each order, we could iterate through the Sales table and use RELATED to access columns in related tables. For example, the following measure displays the details of each of the products in the selected order, and it separates each row (and therefore each product) with a new line character:
Details V2.B =
IF (
    ISINSCOPE ( Sales[Order Number] ),
    CONCATENATEX (
        Sales,
        CONCATENATEX (
            FILTER (
                {
                    Sales[Quantity],
                    RELATED ( 'Product'[Product Name] ),
                    RELATED ( 'Product'[Weight] ),
                    RELATED ( 'Product'[Weight Unit Measure] )
                },
                [Value] <> ""
            ),
            [Value],
            ", "
        ),
        UNICHAR ( 10 )
    )
)
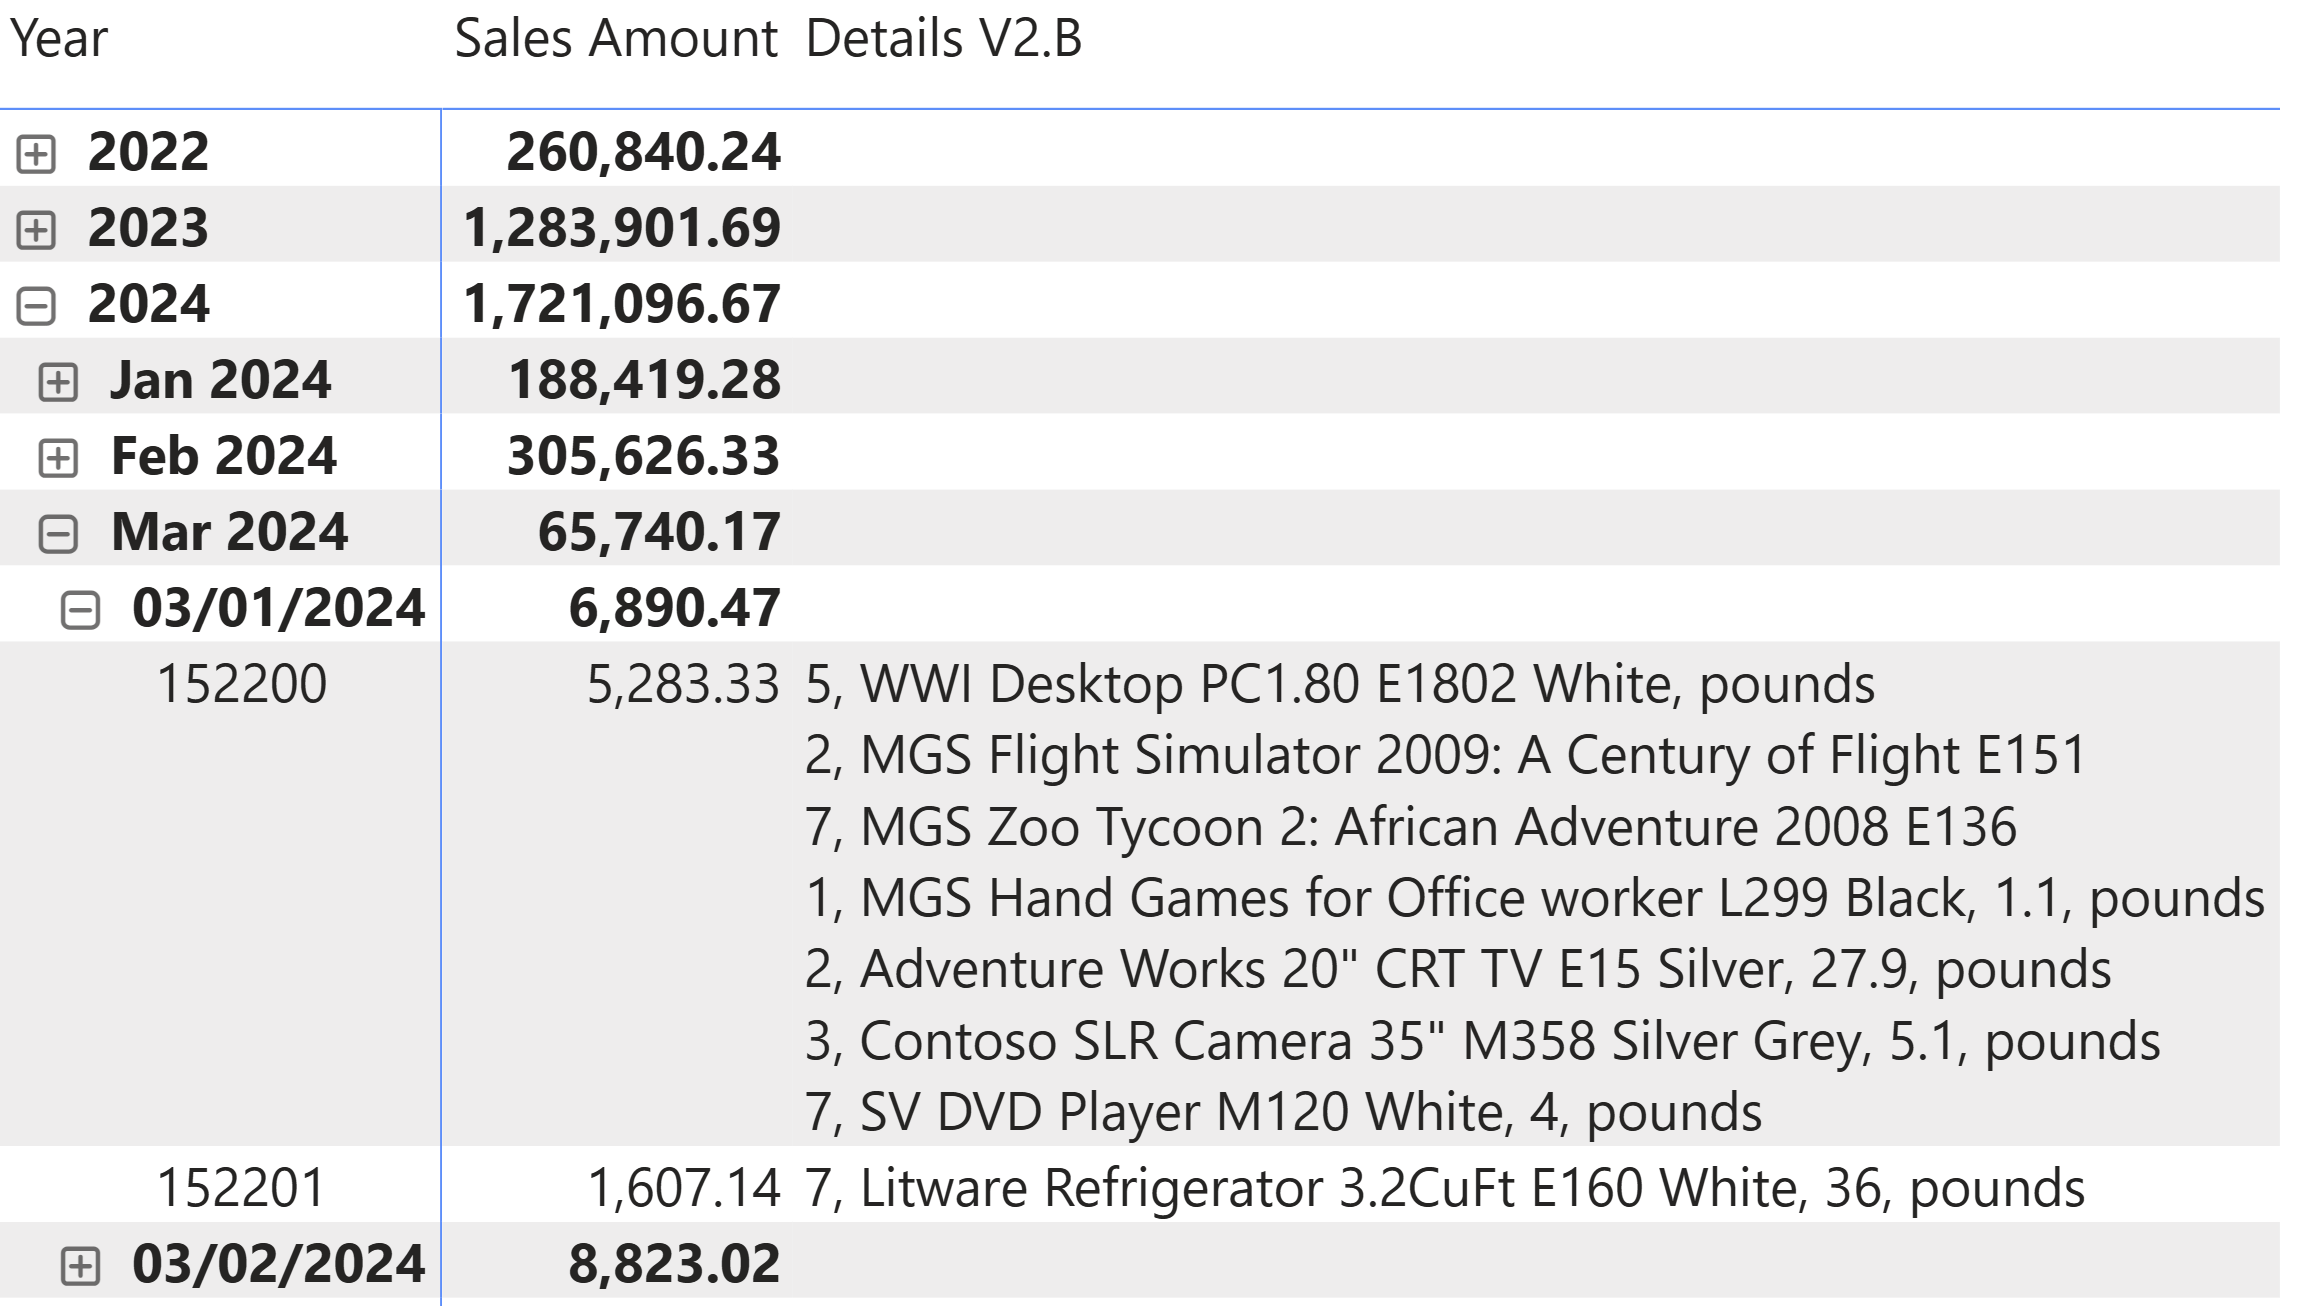
Here are the results we can obtain with this measure: for each row of the order, we see the quantity, the product name, the weight (if present), and the weight unit. We did not implement a logic to hide the weight unit if the weight amount is not present, like for the first row related to WWI Desktop PC1.80 product.
We do not make performance considerations in this case because the example is different from the one we use to compare the approaches. But we believe it was interesting from an educational perspective to show this other scenario.
Details measure – version 3
The last version has the same structure as version 2, but in this case, we obtain a row context to use column references with SUMMARIZE. This way, we do not have to rely on the bidirectional filter and we can also combine columns from different tables:
Details V3 =
IF (
    ISINSCOPE ( Sales[Order Number] ),
    CONCATENATEX (
        SUMMARIZE (
            Sales,
            Customer[Country Code],
            Customer[State Code],
            Customer[City],
            Customer[Name],
            Customer[Age]
        ),
        CONCATENATEX (
            FILTER (
                {
                    Customer[Country Code],
                    Customer[State Code],
                    Customer[City],
                    Customer[Name],
                    Customer[Age]
                },
                [Value] <> ""
            ),
            [Value],
            ", "
        ),
        " - " // This should never be used as long
               // as ISINSCOPE ( Sales[Order Number] ) is True
    )
)
The result is the same as for the previous two versions.

To be honest, this solution is not ideal from a maintenance point of view, because it requires duplicating the list of columns both in SUMMARIZE and in the table constructor used as FILTER argument. However, we wanted to show this approach because it could be more efficient from a query execution perspective.
We have a further reduction of the number of storage engine queries (7 instead of 10), a larger number of rows in the physical execution plan (337 instead of 186, the largest number among all the versions of this measure), and the same maximum number of rows iterated by the formula engine (31) as in version 2.
Thus, is this approach worth using? It really depends on the performance impact measured in a real environment. Our suggestion is to refrain from applying potential optimizations that could make the code longer or harder to read and maintain. Therefore, we suggest using the approach described in version 2; implement version 3 only when you can prove that it achieves faster performance and is necessary for the scenario you are facing.
Details measure – final version
In this final section, we show how to implement our favorite approach (version 2) by moving the repetitive code into a function, thus making it easier to create other detail functions in your reports. The Local.ConcatenateNonEmpty function receives a table with a list of values to display, and a column reference pointing to the column to use (which is [Value] for table constructors with a single column):
Local.ConcatenateNonEmpty = (
    fieldsListTable : TABLE VAL,
    fieldColumn : ANYREF EXPR
) =>
CONCATENATEX (
    FILTER (
        fieldsListTable,
        fieldColumn <> ""
    ),
    fieldColumn,
    ", "
)
The measure reduces its verbosity by invoking the Local.ConcatenateNonEmpty function to implement the inner CONCATENATEX iteration:
Details V2.A fx =
IF (
    ISINSCOPE ( Sales[Order Number] ),
    CONCATENATEX (
        CALCULATETABLE (
            Customer,
            CROSSFILTER ( Sales[CustomerKey], Customer[CustomerKey], BOTH )
        ),
        Local.ConcatenateNonEmpty (
            {
                Customer[Country Code],
                Customer[State Code],
                Customer[City],
                Customer[Name],
                Customer[Age]
            },
            [Value]
        ),
        " - " // This should never be used as long
               // as ISINSCOPE ( Sales[Order Number] ) is True
    )
)
You can find function-based versions of all the measures in the sample file you can download. The role of the function is to just reduce the amount of code to write, without impacting the performance obtained.
Conclusions
We have seen several ways to display transaction details in a compact manner, by using DAX measures. Different approaches can result in different levels of performance, but we must balance performance gains with code readability and maintainability. Counter-intuitively, using nested iterators could be ideal in this scenario because the outer row context gives access to column references, without the additional burden of retrieving each value from the filter context. Using a function to hide repetitive tasks can help you reuse this approach across different measures in your reports.
Returns true when the specified column is the level in a hierarchy of levels.
ISINSCOPE ( <ColumnName> )
When a column name is given, returns a single-column table of unique values. When a table name is given, returns a table with the same columns and all the rows of the table (including duplicates) with the additional blank row caused by an invalid relationship if present.
VALUES ( <TableNameOrColumnName> )
Returns the value when there’s only one value in the specified column, otherwise returns the alternate result.
SELECTEDVALUE ( <ColumnName> [, <AlternateResult>] )
Counts the number of distinct values in a column.
DISTINCTCOUNT ( <ColumnName> )
Evaluates expression for each row on the table, then return the concatenation of those values in a single string result, seperated by the specified delimiter.
CONCATENATEX ( <Table>, <Expression> [, <Delimiter>] [, <OrderBy_Expression> [, [<Order>] [, <OrderBy_Expression> [, [<Order>] [, … ] ] ] ] ] )
Returns a table that has been filtered.
FILTER ( <Table>, <FilterExpression> )
Returns a blank.
BLANK ( )
Evaluates an expression in a context modified by filters.
CALCULATE ( <Expression> [, <Filter> [, <Filter> [, … ] ] ] )
Specifies cross filtering direction to be used in the evaluation of a DAX expression. The relationship is defined by naming, as arguments, the two columns that serve as endpoints.
CROSSFILTER ( <LeftColumnName>, <RightColumnName>, <CrossFilterType> )
Evaluates a table expression in a context modified by filters.
CALCULATETABLE ( <Table> [, <Filter> [, <Filter> [, … ] ] ] )
Returns a related value from another table.
RELATED ( <ColumnName> )
Creates a summary of the input table grouped by the specified columns.
SUMMARIZE ( <Table> [, <GroupBy_ColumnName> [, [<Name>] [, [<Expression>] [, <GroupBy_ColumnName> [, [<Name>] [, [<Expression>] [, … ] ] ] ] ] ] ] )