 Marco Russo
In previous articles, we discussed the importance of variables and how to optimize IF functions to reduce multiple evaluations of the same expression or measure. However, there are scenarios where the calculations executed in different branches of the same expression seem impossible to optimize. For example, consider the following pattern:
Amount :=
IF (
    <condition>,
    [Credit],
    [Debit]
)
In cases like this involving measures A and B, there does not seem to be any possible optimizations. However, by considering the nature of the two measures A and B, they might be different evaluations of the same base measure in different filter contexts. For example, A and B could be defined as:
Raw Amount :=
SUM ( Transactions[Line Amount] )

Credit :=
CALCULATE (
    [Raw Amount],
    Transactions[Type] = "Credit"
)

Debit :=
CALCULATE (
    [Raw Amount],
    Transactions[Type] = "Debit"
)
In this scenario, DAX is likely to generate a query plan where both measures are evaluated internally, even though only one of the two measures is actually displayed in a report – for example, by applying a filter that determines a constant evaluation of the condition in the IF statement. In simple expressions, DAX might apply a short-circuit evaluation that skips the calculation of any branches that are not necessary. However, in complex reports this optimization is often unavailable in order to generate an efficient query plan for bulk evaluations. So, how is it possible to optimize similar expressions?
A rule of thumb when writing DAX code is that preparing filters and then executing a CALCULATE is more convenient than writing different CALCULATE statements for different conditions. Thus, the previous code could be written as follows:
Raw Amount :=
SUM ( Transactions[Line Amount] )

Amount :=
VAR TransactionType =
    IF (
        <condition>,
        "Credit",
        "Debit"
    )
RETURN
    CALCULATE (
        [Raw Amount],
        Transactions[Type] = TransactionType
    )
While in such a simple example this coding might not translate into performance benefits, in complex expressions this approach could be significantly faster. It is a best practice to validate any assumption by testing the performance of both approaches on specific use cases.
However, this technique creates two additional challenges: splitting the calculation in multiple steps using different variables is harder, and creating the proper filter using conditional statements could be complex.
A common example showcasing the benefits of this optimization is a measure displaying a time-intelligence calculation based on the selection of a slicer.
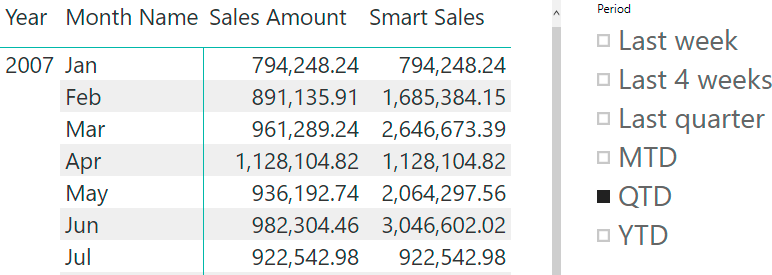
The original Sales Amount and Smart Sales measures definitions are the following:
Sales Amount :=
SUMX ( Sales, Sales[Quantity] * Sales[Net Price] )

Smart Sales :=
IF (
    HASONEVALUE ( Period[Period] ),
    SWITCH (
        VALUES ( Period[Period] ),
        "Last week", CALCULATE (
            [Sales Amount],
            DATESINPERIOD (
                'Date'[Date],
                MAX ( 'Date'[Date] ),
                VALUES ( Period[Offset] ),
                DAY
            )
        ),
        "Last 4 weeks", CALCULATE (
            [Sales Amount],
            DATESINPERIOD (
                'Date'[Date],
                MAX ( 'Date'[Date] ),
                VALUES ( Period[Offset] ),
                DAY
            )
        ),
        "Last quarter", CALCULATE (
            [Sales Amount],
            DATESINPERIOD (
                'Date'[Date],
                MAX ( 'Date'[Date] ),
                VALUES ( Period[Offset] ),
                DAY
            )
        ),
        "MTD", CALCULATE ( [Sales Amount], DATESMTD ( 'Date'[Date] ) ),
        "QTD", CALCULATE ( [Sales Amount], DATESQTD ( 'Date'[Date] ) ),
        "YTD", CALCULATE ( [Sales Amount], DATESYTD ( 'Date'[Date] ) ),
        BLANK()
    )
)
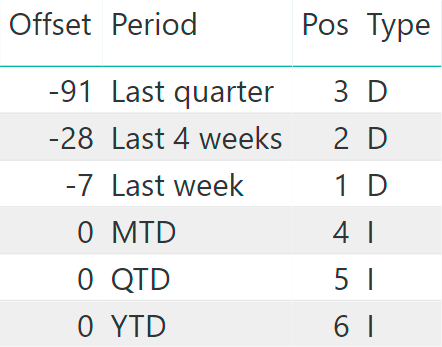
The Period table contains the definition of each time period with a period type column. In this column, “D” indicates the range of days from the last date of the selected time period, and “I” indicates a time period that must be translated in a specific time intelligence function based on the name of the period (MTD, QTD, YTD). The only visible column is Period, which is the column used in the slicer of the previous figure.
The Smart Sales measure can be rewritten with a single CALCULATE by preparing the Date filter in a variable. It would be nice to be able to create a filter expression using a SWITCH function, but unfortunately IF and SWITCH return scalar values and not tables. It is thus impossible to write the following syntax:
VAR FilterDates =
    SWITCH (
        VALUES ( Period[Period] ),
        "Last week",
            DATESINPERIOD (
                'Date'[Date],
                MAX ( 'Date'[Date] ),
                VALUES ( Period[Offset] ),
                DAY
            ),
        "Last 4 weeks",
            DATESINPERIOD (
                'Date'[Date],
                MAX ( 'Date'[Date] ),
                VALUES ( Period[Offset] ),
                DAY
            ),
        "Last quarter",
            DATESINPERIOD (
                'Date'[Date],
                MAX ( 'Date'[Date] ),
                VALUES ( Period[Offset] ),
                DAY
            ),
        "MTD", DATESMTD ( 'Date'[Date] ),
        "QTD", DATESQTD ( 'Date'[Date] ),
        "YTD", DATESYTD ( 'Date'[Date] ),
        BLANK ()
    )
Because IF and SWITCH cannot return a table, they can be used to evaluate the range of dates required for the calculation, passing them to a single DATESBETWEEN function. A possible implementation is the following measure:
Smart Sales New :=
IF (
    HASONEVALUE ( Period[Period] ),
    VAR PeriodName =
        VALUES ( Period[Period] )
    VAR PeriodType =
        VALUES ( Period[Type] )
    VAR LastDaySelected =
        MAX ( 'Date'[Date] )
    VAR LastMonthSelected =
        MONTH ( LastDaySelected )
    VAR LastQuarterMonthSelected =
        FLOOR ( LastMonthSelected - 1, 3 ) + 1
    VAR LastYearSelected =
        YEAR ( LastDaySelected )
    VAR FirstDaySelected =
        IF (
            PeriodType = "D",
            LastDaySelected + VALUES ( Period[Offset] ) + 1,
            DATE (
                LastYearSelected,
                SWITCH (
                    PeriodName,
                    "MTD", LastMonthSelected,
                    "QTD", LastQuarterMonthSelected,
                    "YTD", 1
                ),
                1
            )
        )
    VAR FilterDates =
        DATESBETWEEN (
            'Date'[Date],
            FirstDaySelected,
            LastDaySelected
        )
    VAR Result =
        CALCULATE ( [Sales Amount], FilterDates )
    RETURN
        Result
)
The Smart Sales New measure might display better performance. There is an additional cost required to build the filter, but this could be more efficient than evaluating different CALCULATE statements. The difference is not very visible in the small sample file with the different Smart Sales measures shown in this article. The technique can however have a bigger impact in larger databases – the type that are not easy to reproduce and download for an article.
As usual, knowing different approaches to solve a problem in DAX is always a good idea. Indeed, performance might differ based on specific details of the requirements and on data distribution. When a performance issue arises, there are no special tools available such as indexes or aggregations to solve the problem. It becomes necessary to change the DAX code to obtain a better execution plan.
Checks whether a condition is met, and returns one value if TRUE, and another value if FALSE.
IF ( <LogicalTest>, <ResultIfTrue> [, <ResultIfFalse>] )
Evaluates an expression in a context modified by filters.
CALCULATE ( <Expression> [, <Filter> [, <Filter> [, … ] ] ] )
Returns different results depending on the value of an expression.
SWITCH ( <Expression>, <Value>, <Result> [, <Value>, <Result> [, … ] ] [, <Else>] )
Returns the dates between two given dates.
DATESBETWEEN ( <Dates>, <StartDate>, <EndDate> )