 Marco Russo & Alberto Ferrari
Marketing campaigns drive sales, but not all sales can be directly attributed to a specific campaign. A customer might see a promotion and later purchase the product without using any discount code or campaign link. How do you measure this broader influence? This article presents data modeling and DAX measures to analyze campaign effectiveness by separating attributed sales (transactions for which we can clearly identify the one campaign that generated the sale) from influenced sales (all sales of products participating in one or more campaigns, regardless of whether the sale can be attributed to one exact campaign). The solution includes several measures using a many-to-many relationship between products and campaigns, combined with dynamic CROSSFILTER manipulation, to provide a complete view of the campaign’s impact.
DISCLAIMER: The last two sections (“Interpreting the results” and “Other scenarios”) of this article have been written with the support of AI to assess the business scenarios where the data model and the measures described in this article can be used. The text has been manually edited and reviewed by the authors.
Introduction
Marketing campaigns are designed to drive sales, but measuring their actual impact is challenging. When a customer redeems a discount code or clicks through a promotional link, that sale is clearly attributed to the campaign. But what about the customers who see an advertisement, visit the store a week after the campaign is over, and then purchase the product at full price? The campaign influenced the purchase decision, yet the transaction has no direct link to it.
Traditional attribution models only count directly-tracked conversions, thus underestimating the full value of the campaign. To understand the whole picture, we need to answer several questions:
- How much revenue came directly from campaign transactions?
- How much did campaign products sell in total, regardless of attribution?
- Are there products benefiting from campaigns we are not currently analyzing?
- How are products that are not the object of any campaign, performing?
We will build a set of measures to identify:
- Attributed Sales: Transactions explicitly linked to one campaign.
- Influenced Sales: All sales of products participating in campaigns.
- Unattributed Sales: Campaign product sales without direct attribution.
- Organic Sales: Sales of products that have never participated in any campaign.
These measures provide a complete view of campaign effectiveness beyond simple attribution.
IMPORTANT: For the sake of simplicity, this article does not include the period of validity for a campaign. Depending on your feedback, we may consider including a more complete template in a future article in DAX Patterns. Here, we wanted to focus on the data modeling and DAX code involved in moving from attributed to influenced sales, which can be helpful in situations described in the “Other scenarios” section later in the article.
The data model
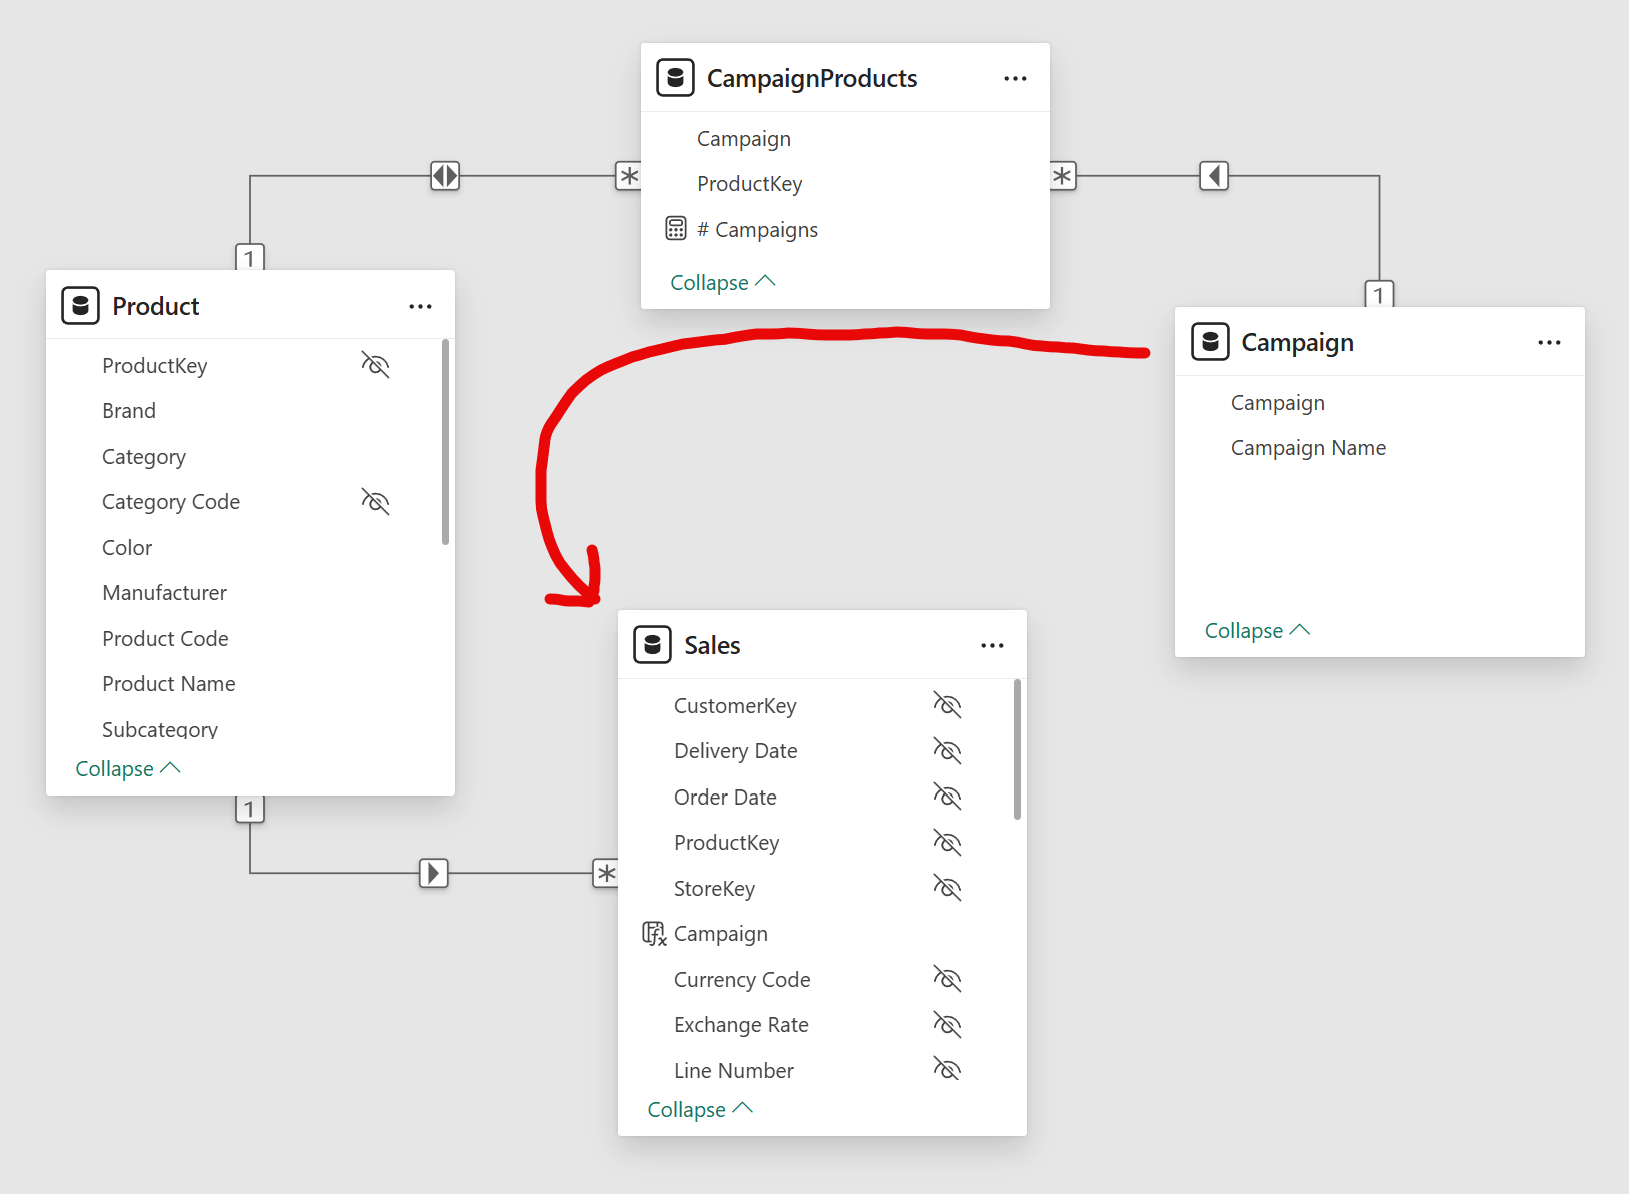
The model is based on the standard Contoso dataset, focusing on the Product and Sales tables for this scenario. We added two additional tables: Campaigns and CampaignProducts. The following diagram shows this part of the semantic model.
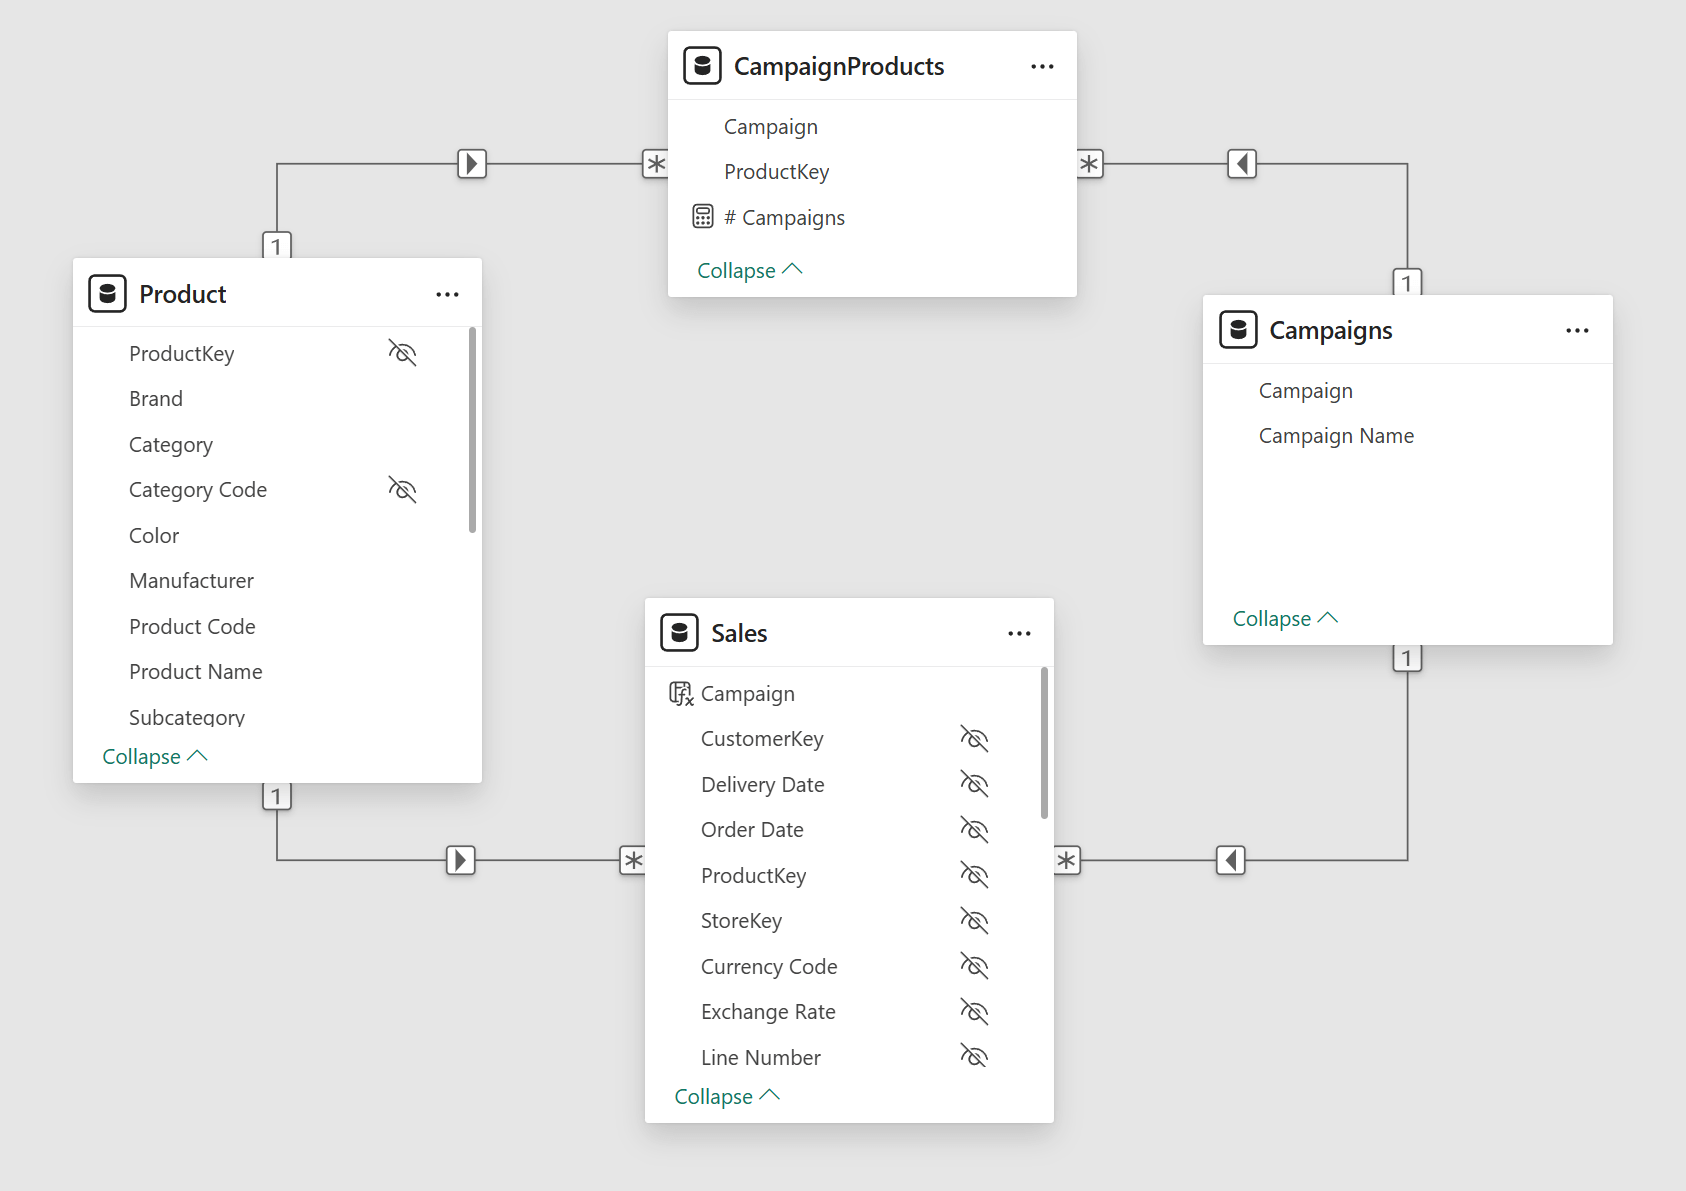
The Sales table includes a Campaign column that stores which campaign, if any, was used for each transaction. This column has a direct relationship to the Campaigns table, defining campaign attribution at the individual transaction level. When a sale is completed through a campaign (e.g., via a discount code or promotional link), the Sales[Campaign] column stores the campaign identifier. When a sale has no campaign involvement, the column is blank.
Campaign is a simple dimension that lists available campaigns. Because the relationship between Campaign and Sales is a regular one-to-many relationship, transactions in Sales with a blank value in Sales[Campaign] generate an additional blank row in the Campaign table. This is intentional. An alternative approach would be creating a fictitious “Not Assigned” campaign to avoid the blank row, but this would complicate the measures: we would need to reference that specific value whenever we want to isolate unattributed sales. Using the blank row instead allows us to rely on the standard ISBLANK function, making the DAX code easier to maintain.
CampaignProducts is a bridge table implementing the many-to-many relationship between Product and Campaign: a product can participate in multiple campaigns, and a campaign can include multiple products. The relationship directions are set to filter from Product to CampaignProducts and from Campaign to CampaignProducts, but not the other way around. This means filtering a campaign does not automatically filter products through the bridge table. The measures we build will selectively activate bidirectional filtering using CROSSFILTER when we need to include all products participating in a campaign, regardless of transaction attribution in Sales.
Building the measures
In the introduction, we raised several questions about measuring campaign effectiveness. We now build a set of measures to answer them, starting from a simple base measure and progressively adding complexity to isolate different perspectives on sales.
Sales Amount
Sales Amount is a standard measure in the Contoso sample model we use and serves as the base measure for our analysis. It calculates total revenue by multiplying quantity and net price for each transaction:
Sales Amount =
SUMX (
    Sales,
    Sales[Quantity] * Sales[Net Price]
)
Each subsequent measure will modify the filter context around Sales Amount to isolate different types of sales.
Attributed Sales
Attributed Sales isolates transactions directly linked to a campaign:
Attributed Sales =
CALCULATE (
    [Sales Amount],
    KEEPFILTERS ( NOT ISBLANK ( Campaign[Campaign] ) )
)
The measure filters Sales Amount to include only transactions where the Campaigns[Campaign] column is not blank, meaning a campaign was explicitly used for the sale. By checking Campaigns[Campaign] rather than Sales[Campaign], we ensure that transactions assigned to unavailable campaigns are included. If you use Sales[Campaign] instead, data quality issues will result in numbers that do not correspond to Sales Amount by summing the following Unattributed Sales measure.
We use KEEPFILTERS to preserve any campaign selection made in the report. Without KEEPFILTERS, the filter NOT ISBLANK ( Campaigns[Campaign] ) would override the existing campaign filter, showing all attributed sales regardless of which campaign is selected. With KEEPFILTERS, the two filters intersect: we see only attributed sales for the selected campaign(s).
Unattributed Sales
Unattributed Sales captures the opposite: transactions with no campaign attribution:
Unattributed Sales =
IF (
    ISINSCOPE ( Campaign[Campaign] ),
    CALCULATE (
        [Sales Amount],
        KEEPFILTERS ( ISBLANK ( Campaign[Campaign] ) )
    ),
    CALCULATE (
        [Sales Amount],
        REMOVEFILTERS ( Campaign ),
        ISBLANK ( Campaign[Campaign] )
    )
)
This measure filters for the blank row in the Campaign table to isolate transactions where Sales[Campaign] is blank or corresponds to a non-existing campaign. These are sales that occurred without involving any tracked, valid campaign.
The ISINSCOPE function determines whether Campaign is part of the report’s grouping hierarchy. When Campaign[Campaign] is in scope – for example when viewing individual campaigns within a brand, even when you look at the data by Campaign[Campaign Name] because it is sorted by Campaign[Campaign] – the measure uses KEEPFILTERS to intersect the blank campaign filter with any existing selection. This returns a value only on the blank row itself.
When Campaign[Campaign] is not in scope (for example, when viewing only at the brand level), the measure uses REMOVEFILTERS to ignore any campaign selection and then filters for the blank campaign. This ensures that Unattributed Sales displays a value at the brand level even when the user has selected specific campaigns in a slicer. Without this logic, selecting one or more campaigns would hide unattributed sales at aggregated levels, making it harder to understand the complete picture.
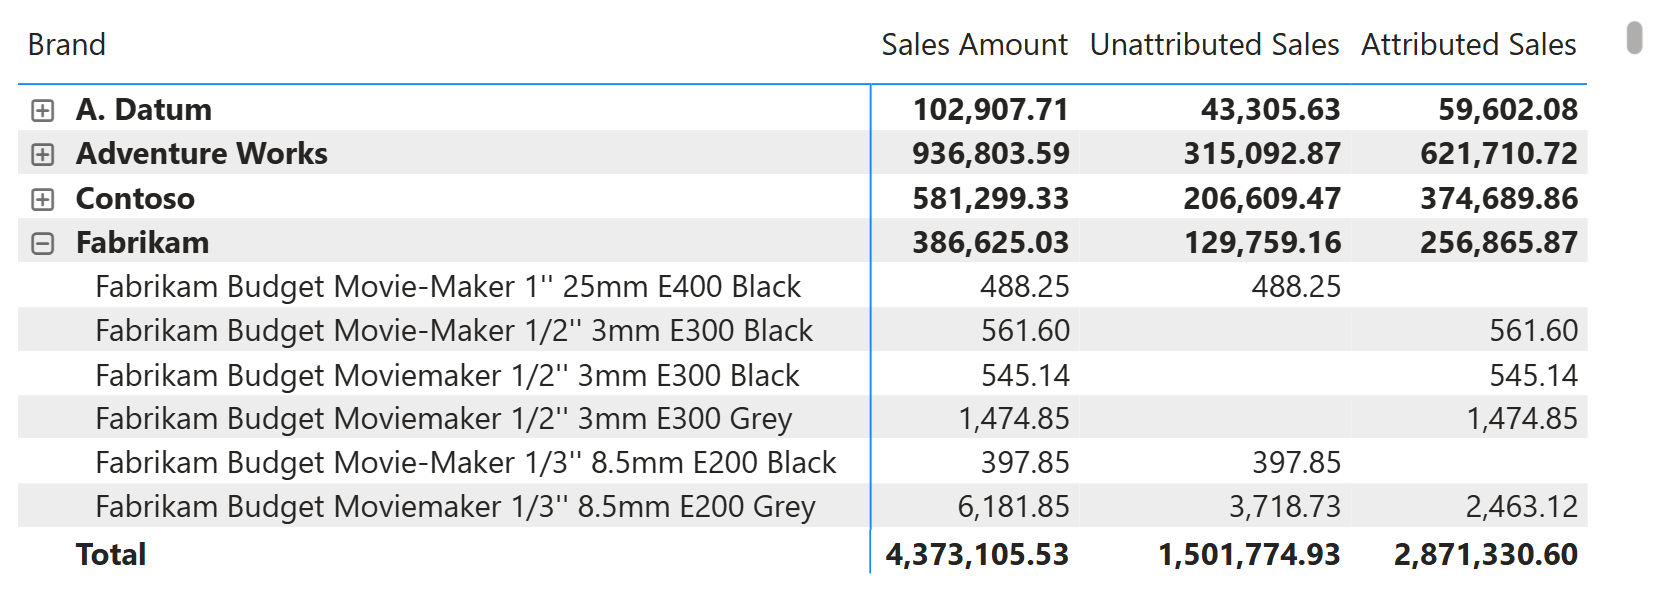
Attributed Sales and Unattributed Sales are complementary. For any given product, their sum equals the total Sales Amount, as shown in the following picture. This makes them helpful for understanding which portion of revenue is directly trackable to campaigns and which is not.
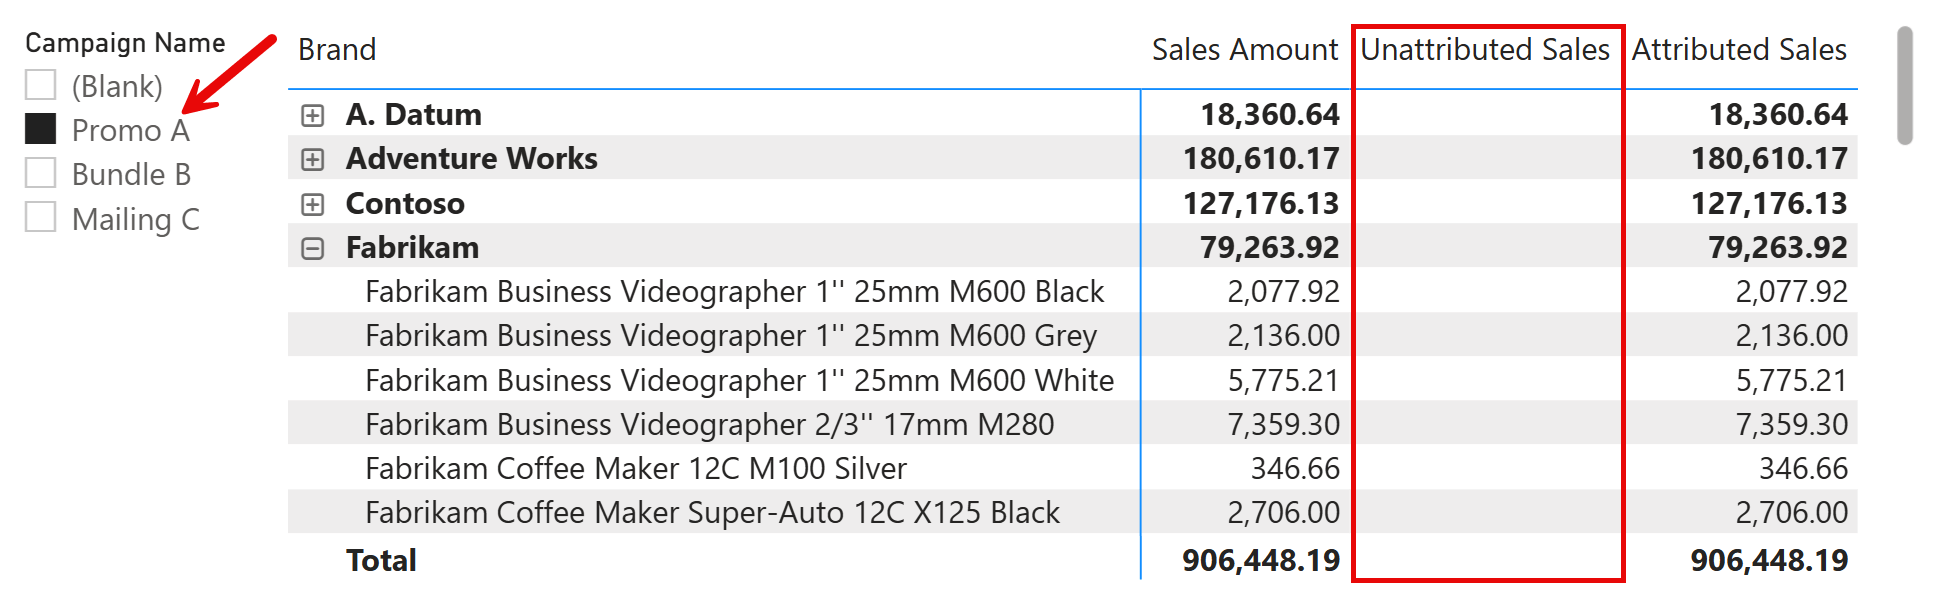
The Campaign table can filter the measures we showed so far. However, if you filter a campaign, the Unattributed Sales will always be blank, as shown in the following picture.
Total Sales
Total Sales shows the complete revenue, ignoring any campaign filter applied in the report:
Total Sales =
CALCULATE (
    [Sales Amount],
    REMOVEFILTERS ( Campaign )
)
The measure uses REMOVEFILTERS to remove any selection on the Campaign table, ensuring we always see the full sales amount regardless of any selected campaign.
The following report illustrates how Total Sales differs from Sales Amount. The matrix shows Product[Brand] on rows with Campaign[Campaign Name] as a nested hierarchy. Looking at the Contoso brand: at the brand level, both Sales Amount and Total Sales show 581,299.33, which is the total sales for all Contoso products.
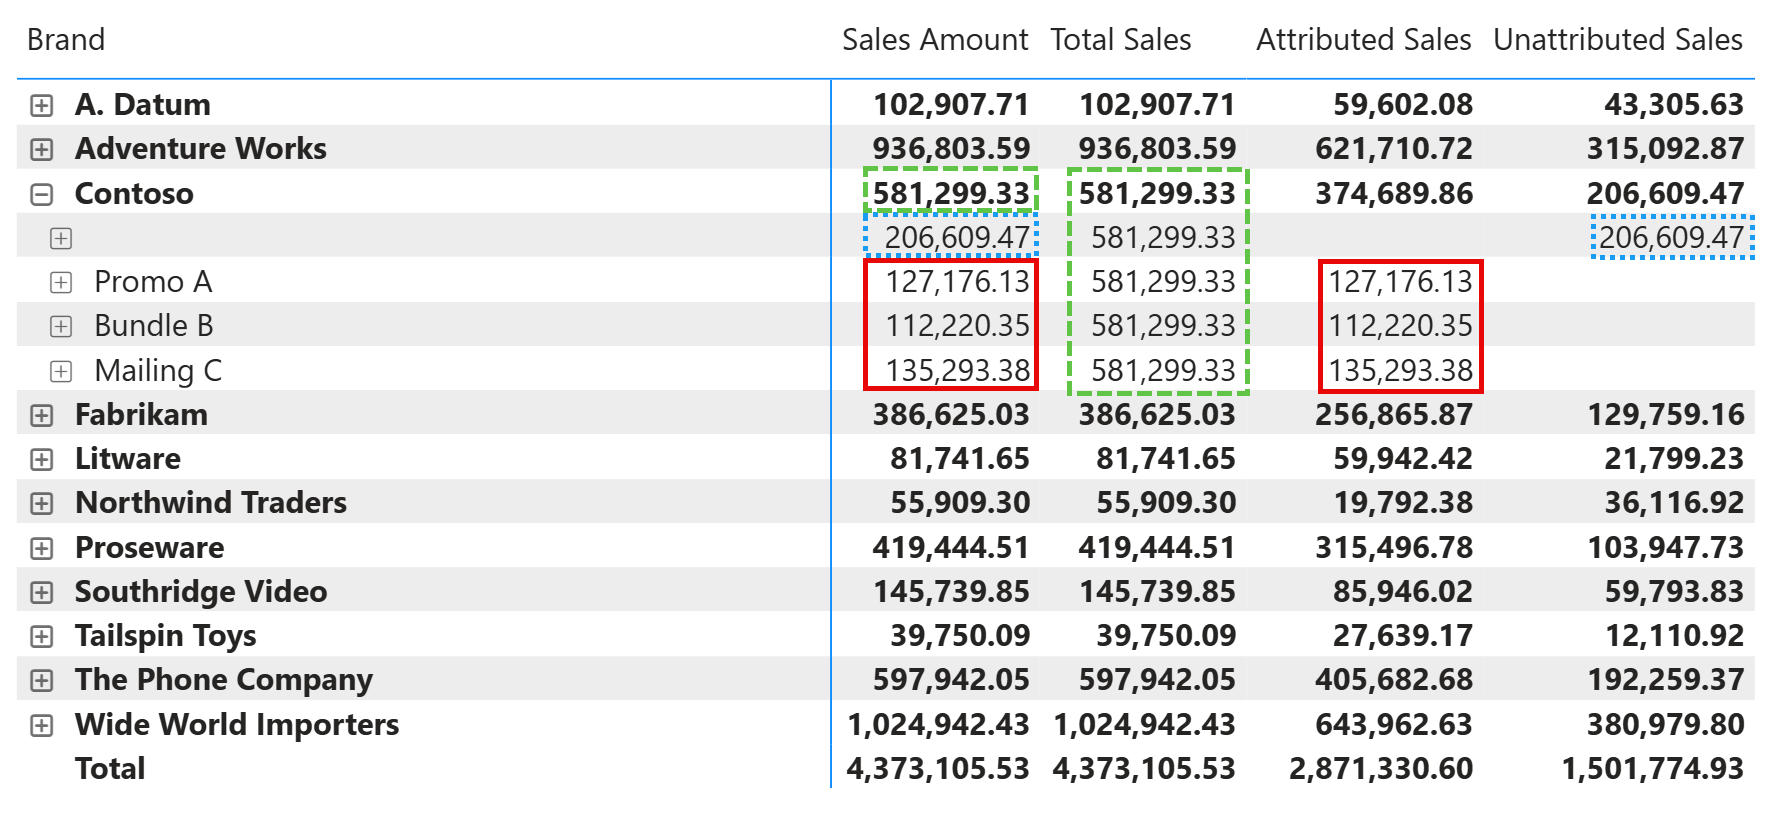
When we expand Contoso to see individual campaigns, the behavior diverges. The blank row (highlighted with a green dashed border) represents unattributed sales: Sales Amount shows 206,609.47, while Total Sales remains at 581,299.33. For the individual campaigns (Promo A, Bundle B, and Mailing C, highlighted with red solid borders), Sales Amount shows only the transactions attributed to each campaign, while Total Sales consistently displays the brand total of 581,299.33.
The report also highlights that Attributed Sales shows the value of products associated with selected campaigns; the measure is additive because each product can be attributed to only one campaign. Unattributed Sales shows the value you see in Sales Amount when the blank campaign is selected.
This pattern makes Total Sales a helpful reference point. When analyzing a specific campaign, you can compare Attributed Sales against Total Sales to understand what fraction of overall brand revenue came through that campaign. The measure provides a stable context regardless of the filtered campaigns.
Influenced Sales
Influenced Sales is the most complex measure. It captures all sales of products participating in the selected campaigns, regardless of whether each transaction was attributed to a campaign. To understand how it works, it is helpful to look at a report that compares Sales Amount and Influenced Sales for different campaigns.
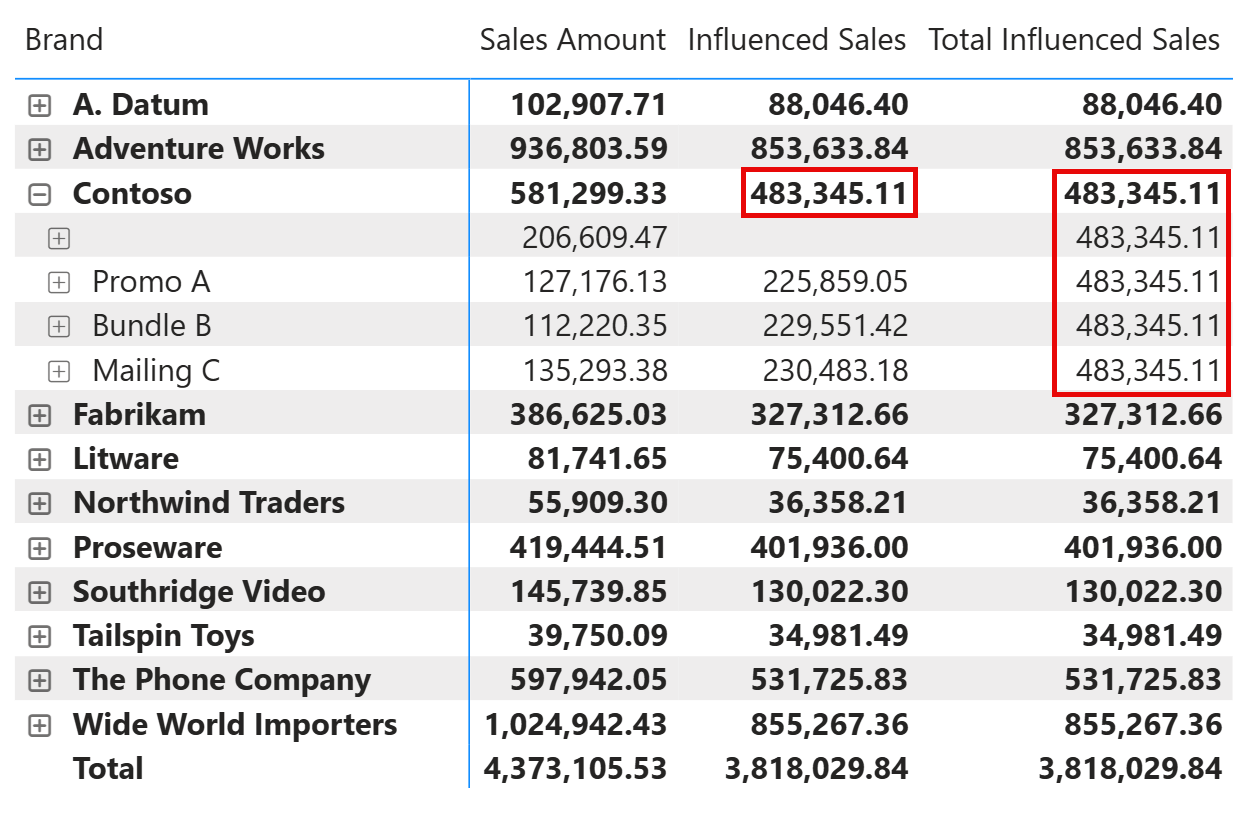
Looking at the Contoso brand, at the brand level, Influenced Sales shows 483,345.11, which is lower than Sales Amount (581,299.33). This is because Influenced Sales only includes products that participate in at least one campaign. Contoso products outside any campaign are excluded.
When we expand Contoso to see individual campaigns, the difference between the two measures becomes clear. For Promo A, Sales Amount shows 127,176.13, only the transactions directly attributed to that campaign. Influenced Sales shows 225,859.05, which corresponds to all sales of products participating in Promo A, regardless of whether the transaction was linked to the campaign. The gap between these two values represents potential campaign influence that is not captured by direct attribution.
Notice that the blank row shows no value for Influenced Sales. This is correct: since no campaign is selected for that row, there are no campaign products to evaluate. Total Influenced Sales shows the same value across all rows within a brand. This measure ignores the campaign filter and will be explained later in the article.
The Influenced Sales measure computes the Sales Amount value using the filter propagation described in the following diagram, where Campaign filters Sales by filtering the products (in Product) that belong to the selected campaigns (in CampaignProducts).
This is the implementation of the Influenced Sales measure:
Influenced Sales =
VAR HasCampaigns = COUNTROWS ( CampaignProducts ) > 0
VAR Result =
    CALCULATE (
        DIVIDE ( [Sales Amount] + 0, HasCampaigns ),
        VALUES ( Campaign[Campaign] ), -- Forces selected or all campaigns
        CROSSFILTER ( CampaignProducts[ProductKey], 'Product'[ProductKey], BOTH ),
        CROSSFILTER ( Sales[Campaign], Campaign[Campaign], NONE )
    )
RETURN Result
The measure requires two CROSSFILTER modifications to reshape how filters propagate through the model.
First, CROSSFILTER ( CampaignProducts[ProductKey], ‘Product'[ProductKey], BOTH ) enables bidirectional filtering between CampaignProducts and Product. When a campaign is selected, the filter flows from Campaigns → CampaignProducts → Product → Sales, capturing all transactions for products in that campaign.
Second, CROSSFILTER ( Sales[Campaign], Campaign[Campaign], NONE ) disables the direct relationship between Sales and Campaigns. Without this, the campaign filter would also flow directly to Sales via the Campaign[Campaign] column, limiting results to only attributed transactions. By disabling this path, we ensure the filter reaches Sales only through the Product relationship.
VALUES ( Campaign[Campaign] ) enforces a filter based on the selected campaigns. This is necessary when no campaigns are selected: in that case, there would be no filter to propagate from Campaign, therefore all products would be visible. In this condition, for this measure, we want to filter only products that have at least one campaign.
Finally, the DIVIDE pattern handles an edge case: when a product participates in a campaign but has no sales, we want to return zero rather than blank. The expression DIVIDE ( [Sales Amount] + 0, HasCampaigns ) returns 0 when Sales Amount is blank and campaigns exist for the selected products; when the products are not present in any of the selected campaigns, then the result is blank (because of a division by zero) and the product will not be removed from the report if all the other measures displayed are blank. This ensures that products in a campaign with zero sales remain visible in reports when analyzing campaign reach.
Total Influenced Sales
Total Influenced Sales extends the previous measure to show influenced sales across all campaigns, ignoring the current campaign selection:
Total Influenced Sales =
CALCULATE (
    [Influenced Sales],
    REMOVEFILTERS ( Campaign ),
    NOT ISBLANK ( Campaign[Campaign] )
)
The NOT ISBLANK ( Campaigns[Campaign] ) filter selects all campaigns, overriding any specific campaign filter in the report. The measure then calculates Influenced Sales for this broader selection.
This is useful for comparison: if Total Influenced Sales is significantly higher than Influenced Sales for the selected campaign, it indicates that other campaigns are also driving sales of overlapping products. Analysts can use this to identify cross-campaign effects or to ensure they are not missing important campaign interactions.
The following report shows the Contoso brand expanded to the product level, with the Mailing C campaign selected. This view reveals how to interpret Influenced Sales and Total Influenced Sales and highlights several interesting scenarios.
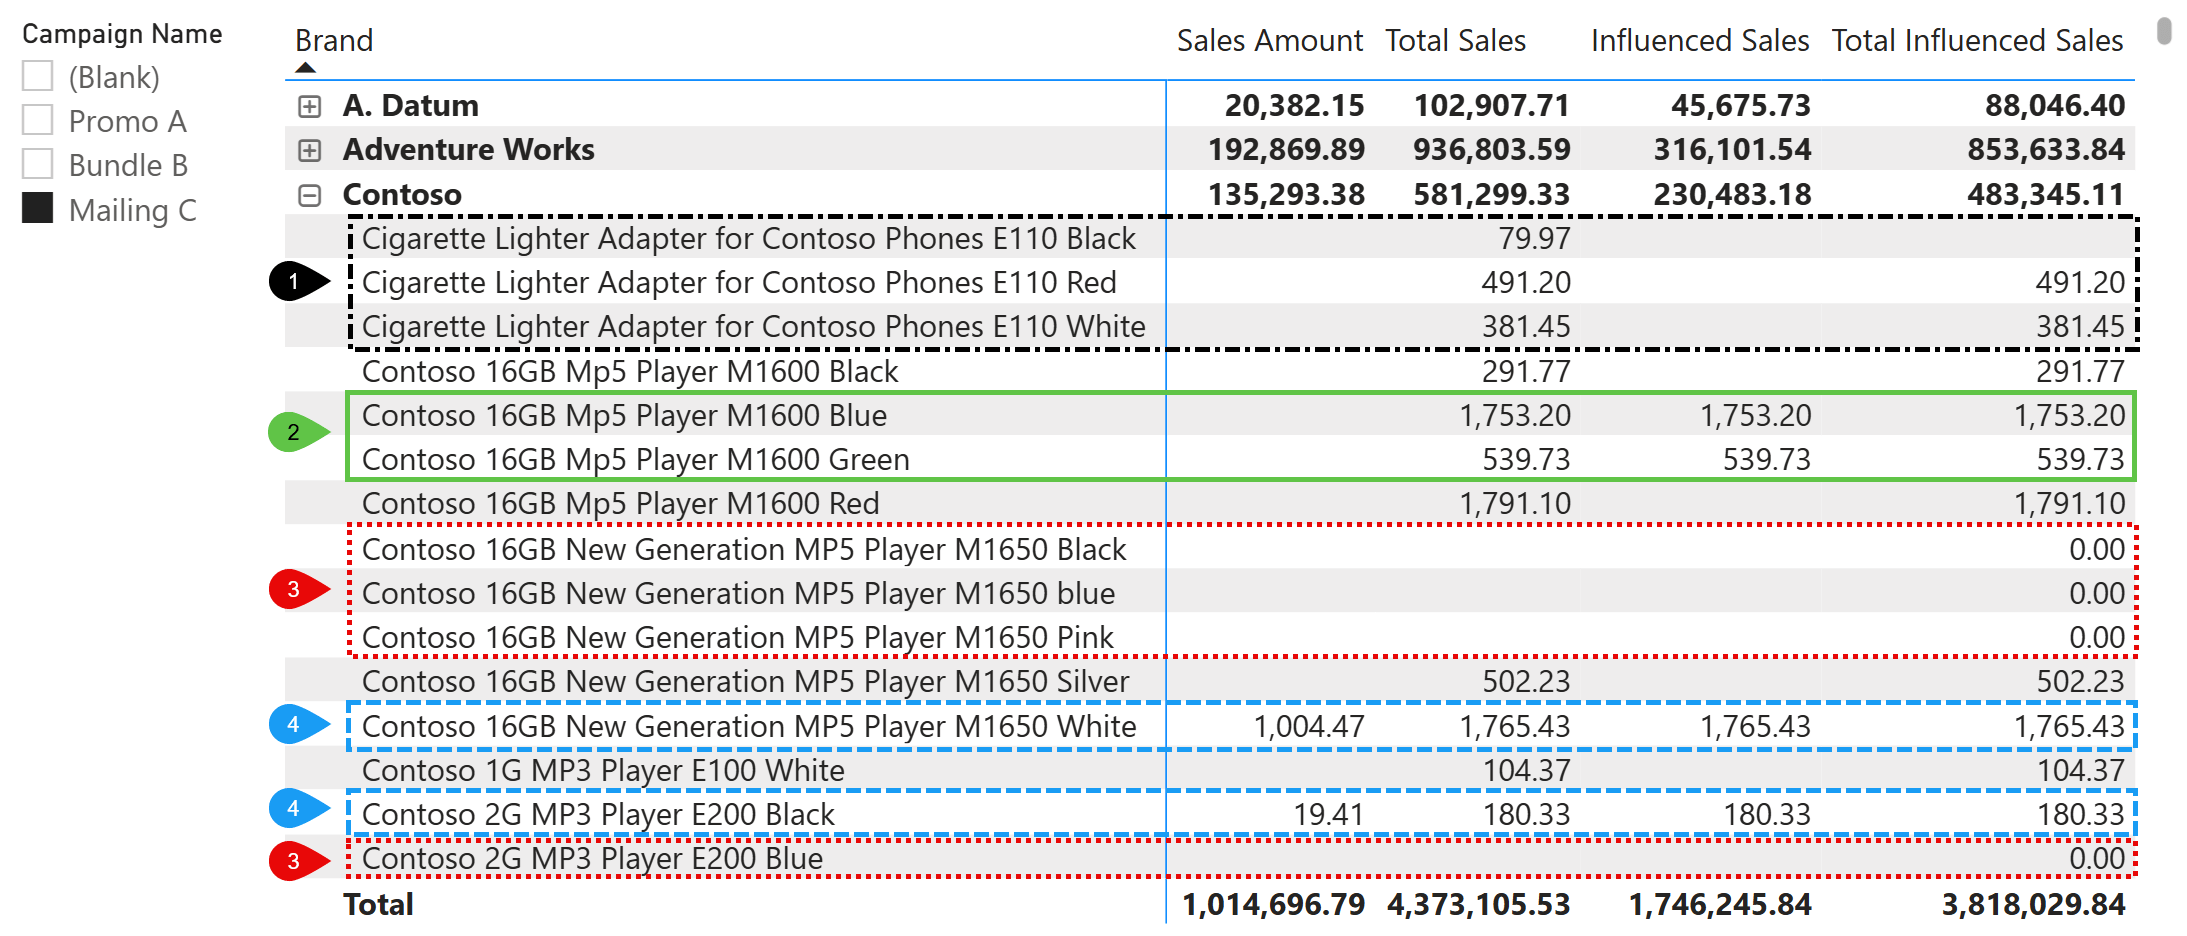
Point 1 (black dashed border) shows products with neither attributed sales nor influenced sales for Mailing C. The Cigarette Lighter Adapter products do not participate in the Mailing C campaign, yet their sales appear in Total Sales (79.97, 491.20, 381.45). Sales Amount is blank because none of these transactions were attributed to Mailing C, and Influenced Sales is also blank because these products are not part of the selected campaign. The difference emerges in Total Influenced Sales: the Black variant shows blank, while the Red and White variants show values matching Total Sales. This distinction occurs because the Red and White variants belong to at least one campaign (just not Mailing C), so their Total Influenced Sales equals their Total Sales. For any single product, if Total Influenced Sales has a value, it will match Total Sales. The Black variant does not participate in any campaign, which is why Total Sales has a value but Total Influenced Sales is blank.
Point 2 (green solid border) shows products where all measures align. The Contoso 16GB Mp5 Player M1600 Blue and Green variants have Sales Amount, Influenced Sales, and Total Influenced Sales all showing the same value. This indicates that these products are exclusively in Mailing C, all their sales were attributed to the campaign, and no other campaigns include them.
Point 3 (red dashed border) shows products in the campaign with zero sales. These products participate in at least one campaign other than Mailing C but have no transactions in Sales. Total Influenced Sales shows 0.00 rather than blank, making these products visible in the report. If the products were also included in the Mailing C campaign, they would show 0.00 also for the Influenced Sales measure. This is the edge case handled by the DIVIDE pattern in the Influenced Sales measure: we want to distinguish between “no sales” (0.00) and “not in campaign” (blank).
Point 4 (blue dashed border) shows products where Influenced Sales exceeds Sales Amount. For the Contoso 16GB New Generation MP5 Player M1650 White, Influenced Sales is 1,765.43, but Sales Amount is only 1,004.47. The Contoso 2G MP3 Player E200 Black shows a similar pattern: Sales Amount is 19.41, while Influenced Sales is 180.33. These gaps reveal the difference between attributed and unattributed sales for products in the selected campaign. When a product belongs to the selected campaign (Mailing C in this example), Total Sales, Influenced Sales, and Total Influenced Sales will always match at the product level, as shown for these highlighted products. However, at the Contoso brand level, the values differ because they aggregate products with different conditions, as illustrated in the previous points.
Organic Sales
Organic Sales isolates revenue from products that have never participated in any campaign:
Organic Sales =
IF (
    NOT ISINSCOPE ( Campaign[Campaign] ),
    VAR ProductsWithoutCampaigns =
        CALCULATETABLE (
            FILTER (
                'Product',
                ISEMPTY ( RELATEDTABLE ( CampaignProducts ) )
            ),
            REMOVEFILTERS ( Campaign )
        )
    VAR Result =
        CALCULATE (
            [Sales Amount],
            ProductsWithoutCampaigns,
            REMOVEFILTERS ( Campaign )
        )
    RETURN Result
)
The measure first identifies products with no campaign participation (ProductsWithoutCampaigns). The CALCULATETABLE expression iterates over Product, keeping only those where there are no campaigns. We apply REMOVEFILTERS on Campaign to ensure this evaluation considers all campaigns, not just those selected in the report. Product sales should be regarded as “organic” only if the product has never appeared in any campaign.
The second CALCULATE then computes Sales Amount for these products only and stores the value in Result. In this case, REMOVEFILTERS on Campaign ensures we ignore any campaign selection.
The initial ISINSCOPE check ensures that the measure returns a value only when Campaign is not part of the report’s grouping hierarchy. When users filter campaigns through a slicer or other external filter, the measure still displays results because it ignores the campaign selection. However, when Campaign appears as a row or column in the visual, the measure returns a blank value to avoid confusion, since organic products, by definition, do not belong to any campaign.
Conceptually, Organic Sales equals the difference between Total Sales and Total Influenced Sales when using additive measures like Sales Amount, as demonstrated in the following report, where Check Organic is computed using a visual calculation:
Check Organic = [Total Sales] - [Total Influenced Sales]
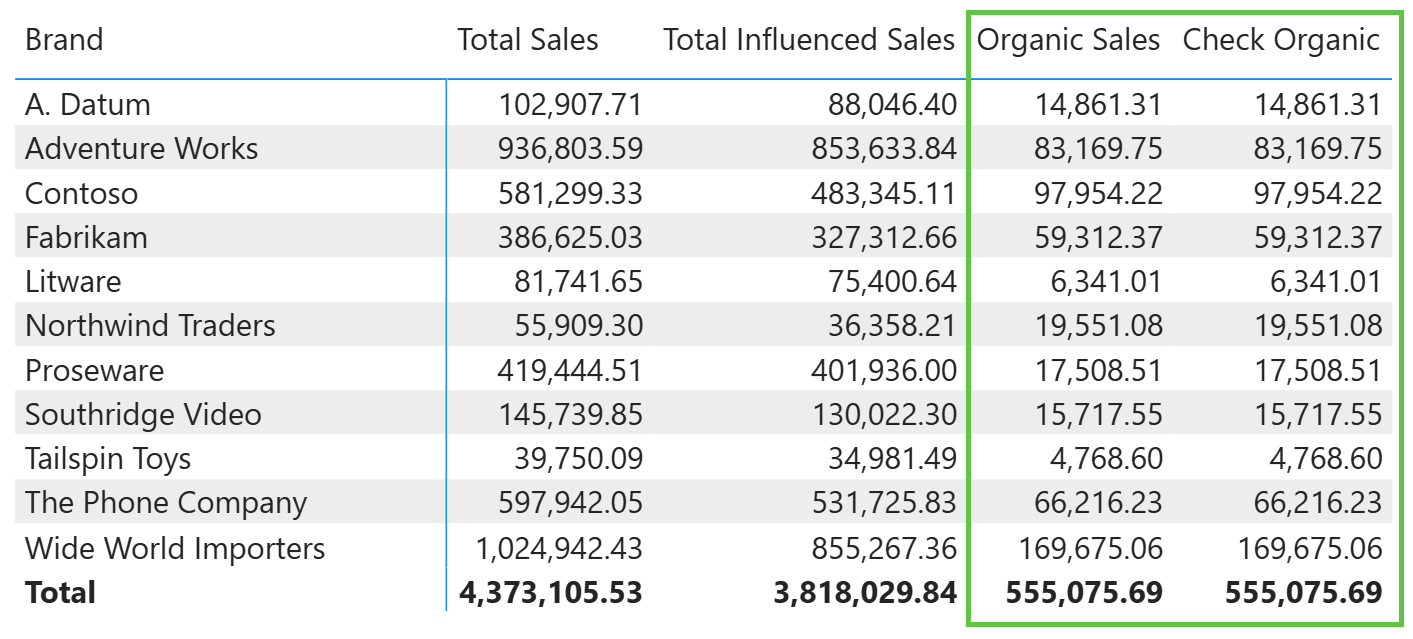
However, it is a good idea to know how to compute it correctly for any measure, including non-additive ones, using the code shown in the Organic Sales measure.
Organic Sales serves as a baseline. These products have no campaign exposure, so their performance reflects purely organic demand. Comparing Organic Sales trends to Influenced Sales for a group of products can help quantify the overall lift generated by campaign activity. For example, consider the following report.
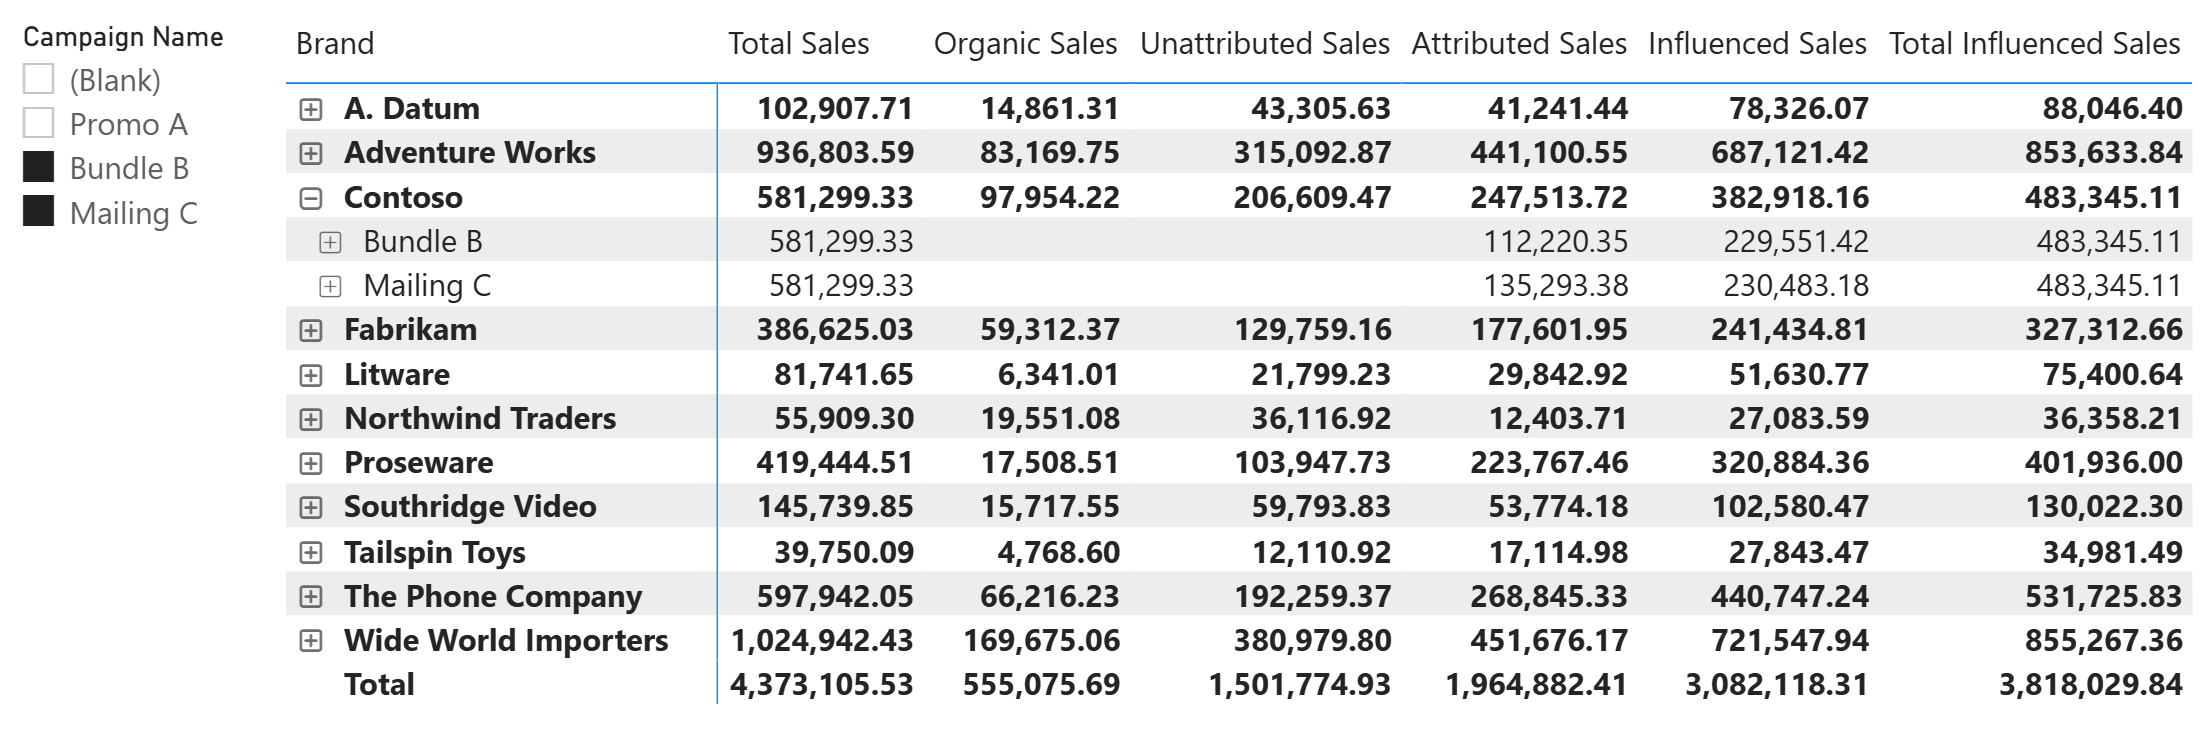
The report shows all measures together for two campaigns: Bundle B and Mailing C. At the brand level (like Contoso), each measure provides a distinct perspective. Total Sales shows overall revenue regardless of campaign filters. Organic Sales isolates products outside any campaign, serving as a baseline for non-promoted performance. Unattributed Sales captures transactions with no campaign link, displayed even though specific campaigns are selected in the slicer. Attributed Sales shows revenue directly tracked to the selected campaigns, while Influenced Sales expands this to include all sales of products participating in those campaigns. Total Influenced Sales provides a reference across all campaigns, which helps identify whether products in the selected campaigns also belong to other campaigns.
Expanding the Contoso brand reveals campaign-level detail. Organic Sales and Unattributed Sales display blank at this level because they are not meaningful when a specific campaign is in scope. Total Sales repeats the brand total since it ignores campaign filters. Attributed Sales and Influenced Sales show campaign-specific values, while Total Influenced Sales remains constant and reflects the broader amount influenced by all existing campaigns.
Reading across the columns, analysts can quickly assess campaign performance: the gap between Attributed Sales and Influenced Sales reveals untracked potential impact, Organic Sales provides a control group for comparison, and Total Influenced Sales highlights cross-campaign overlap.
Interpreting the results
The measures we built provide different perspectives on campaign effectiveness. Reading them together reveals insights that no single measure could provide on its own.
How to read the measures together
Start with Sales Amount as your baseline: this is the total revenue under the current filter context, including any campaign selection. When a campaign is selected, Sales Amount shows only the transactions attributed to that campaign. However, when you combine different measures in the same report, you may want to use Attributed Sales instead of Sales Amount to simplify comparisons with other measures.
Compare Attributed Sales to Influenced Sales to understand the broader reach. Influenced Sales includes all revenue from products participating in the selected campaign, regardless of attribution. If Influenced Sales is significantly higher than Attributed Sales, the campaign products are selling well, but many transactions are not being tracked as campaign sales. This could indicate that customers are exposed to the campaign but complete purchases through other channels.
Use Total Sales as a reference point. This measure ignores campaign filters entirely, showing the complete revenue picture. Comparing Attributed Sales to Total Sales reveals the fraction of overall revenue directly attributable to campaigns.
Total Influenced Sales helps identify cross-campaign effects. If Total Influenced Sales is higher than Influenced Sales for a selected campaign, other campaigns also include some of the same products. This overlap might indicate redundant campaign targeting or deliberate cross-promotion strategies.
Finally, Organic Sales isolates products outside any campaign activity. This provides a control group for evaluating whether campaigns are genuinely lifting sales or simply capturing demand that would have occurred anyway.
Example analysis: comparing Attributed vs Influenced
Consider a scenario where a brand shows the following values for a selected campaign.
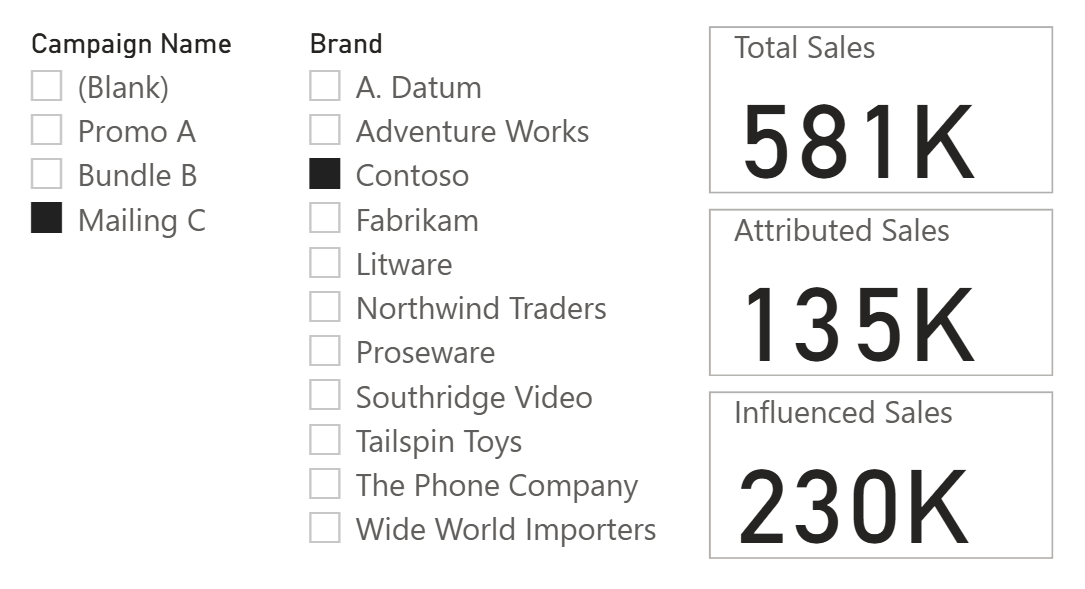
Attributed Sales represent only 23% of total brand revenue (Total Sales) and 59% of Influenced Sales. This means that 41% of campaign product sales occurred without direct attribution. Several interpretations are possible: customers may have seen the campaign and purchased later without using a promo code, or the campaign may have raised awareness that led to purchases across different channels. The gap between Attributed Sales and Influenced Sales quantifies this untracked potential impact.
If the business goal is to maximize tracked conversions, this gap suggests an opportunity to improve attribution mechanisms. If the goal is brand awareness, the higher Influenced Sales figure may be the more relevant success metric.
Using Organic Sales as a baseline
Organic Sales measures revenue from products that have never participated in any campaign. This baseline serves two purposes.
First, it provides a comparison point for campaign product performance. If Influenced Sales for campaign products grows faster than Organic Sales over time, campaigns may be generating incremental lift. If both grow at similar rates, the campaigns might simply be capturing existing demand rather than creating new sales.
Second, Organic Sales helps calibrate expectations. Products outside campaigns represent unassisted performance. Comparing per-product averages between campaign and non-campaign products can reveal whether campaign selection criteria are effective. If products without campaigns outperform those with campaigns, the targeting strategy may need revision.
Other scenarios
The pattern described in this article applies to any situation where you need to measure both direct attribution and broader influence. The key requirement is a many-to-many relationship between products (or other entities) and some grouping that may drive sales without explicit tracking. Here are some examples.
Store events or in-store displays. Retailers often feature products in special displays or promotional events. A customer might notice a product at an endcap display but purchase it later during a regular shopping trip, with no record linking the sale to the display. Comparing attributed sales (transactions during the event) to influenced sales (all sales of featured products) reveals the display’s broader impact.
Email marketing. Products highlighted in newsletters may generate immediate clicks, but they also build awareness that leads to purchases days or weeks later through other channels. The influenced sales measure captures this delayed effect that click-through attribution misses.
Influencer partnerships. When influencers promote products, followers often purchase through general channels rather than tracked affiliate links. Measuring total sales of promoted products against attributed affiliate conversions quantifies the influencer’s true reach.
Seasonal or thematic collections. Retailers group products into collections like “Summer Essentials” or “Back to School.” These collections drive traffic and awareness, but customers may buy individual items without any collection-level tracking. Influenced Sales for a collection shows its overall contribution to revenue.
B2B account-based marketing. In B2B contexts, marketing campaigns target specific accounts. Deals closed by sales teams may not carry campaign attribution even when marketing activity influenced the relationship. Comparing the value of attributed deals to total revenue from targeted accounts measures marketing’s broader contribution.
Loyalty program analysis. Featured products in loyalty programs may see increased purchases from members who never redeem points or rewards for those specific items. Influenced Sales shows total member purchases of featured products, regardless of whether rewards are redeemed.
Conclusions
This article presented a pattern for measuring campaign effectiveness beyond direct attribution. The solution relies on a many-to-many relationship between products and campaigns, implemented through a bridge table, combined with the selective use of CROSSFILTER to control how filters propagate through the model.
The article includes several measures that serve different questions:
- Attributed Sales answers “What did the campaign directly generate?”
- Influenced Sales answers “How did campaign products perform overall?”
- Organic Sales provides a baseline for products outside campaign activity.
You do not have to use all the measures presented; choose only those that meet your requirements!
Specifies cross filtering direction to be used in the evaluation of a DAX expression. The relationship is defined by naming, as arguments, the two columns that serve as endpoints.
CROSSFILTER ( <LeftColumnName>, <RightColumnName>, <CrossFilterType> )
Checks whether a value is blank, and returns TRUE or FALSE.
ISBLANK ( <Value> )
Changes the CALCULATE and CALCULATETABLE function filtering semantics.
KEEPFILTERS ( <Expression> )
Returns true when the specified column is the level in a hierarchy of levels.
ISINSCOPE ( <ColumnName> )
Clear filters from the specified tables or columns.
REMOVEFILTERS ( [<TableNameOrColumnName>] [, <ColumnName> [, <ColumnName> [, … ] ] ] )
When a column name is given, returns a single-column table of unique values. When a table name is given, returns a table with the same columns and all the rows of the table (including duplicates) with the additional blank row caused by an invalid relationship if present.
VALUES ( <TableNameOrColumnName> )
Safe Divide function with ability to handle divide by zero case.
DIVIDE ( <Numerator>, <Denominator> [, <AlternateResult>] )
Evaluates a table expression in a context modified by filters.
CALCULATETABLE ( <Table> [, <Filter> [, <Filter> [, … ] ] ] )
Evaluates an expression in a context modified by filters.
CALCULATE ( <Expression> [, <Filter> [, <Filter> [, … ] ] ] )