One trivial approach is creating a calculated measure for each combination of measure and date-calculation. While this works, it results in a multiplication of the number of measures, making the cube hard to use. Analysis Services offers a feature called Time Intelligence Wizard that creates some calculated members on dedicated Date attributes. This works in MDX but has several limitations:
- It limits the measures on which the calculation are applied (each time you add a new measure, you need to update the wizard-generated MDX scripts)
- It only applies to selected hierarchies – it doesn’t work, for example, if you cross Month and Years on rows and columns.
- It doesn’t work well with Excel 2007 after you install Analysis Services 2005 SP2 – see my rants here.
While the first two issues can be solved by using the same architectural approach of Time Intelligence Wizard, simply writing a different MDX Scripts, solving the third issue (Excel 2007 compatibility) requires a different architecture. For the sake of Google/MSN Live desperate users, I’m going to describe “how to make calculated members working on non-measures dimension with Analysis Services 2005 SP2 and Excel 2007”. I hope that Microsoft will consider a similar approach on a future version of Time Intelligence Wizard…
You can download the solution here »
The issue
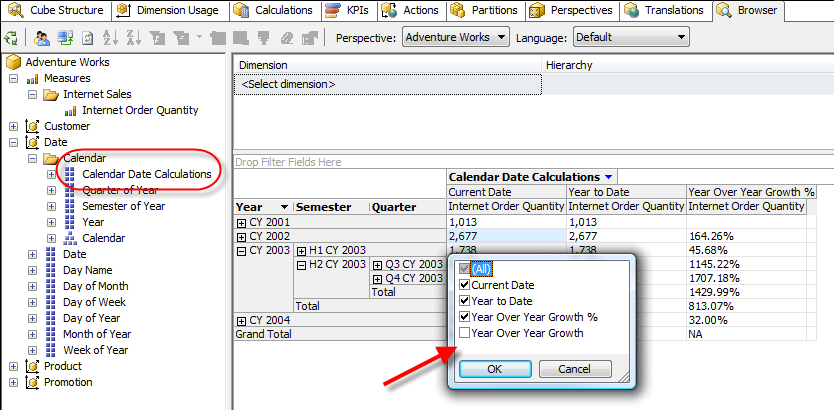
Let’s start describing the Excel 2007 SP2 issue. I created a small subset of Adventure Works sample cube. Calendar Date Calculations is the wizard-generated attribute. With BIDS browser (built using OWC 11) you can put this dimension on the columns of a pivot table with Calendar hierarchy placed on rows, and you can select any set of members from the Calendar Date Calculations attribute. In this example I unchecked one of the members generated by Time Intelligence Wizard.
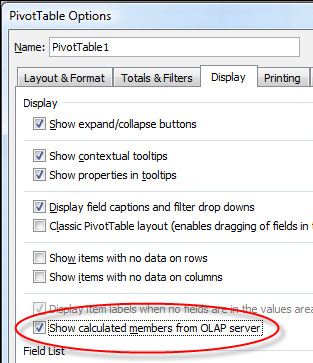
With Excel 2007 the same cube is usable only if you enable the “Show calculated members from OLAP server” on the PivotTable Options dialog box (it’s unchecked by default).
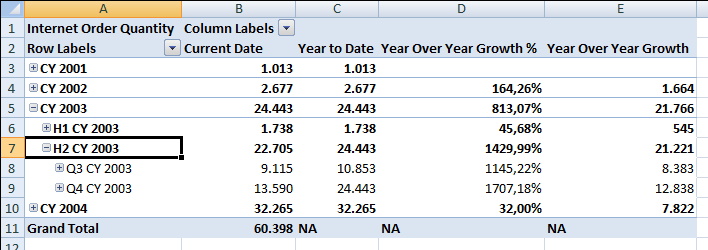
Now we can generate a PivotTable similar to the one generated with BIDS browser.
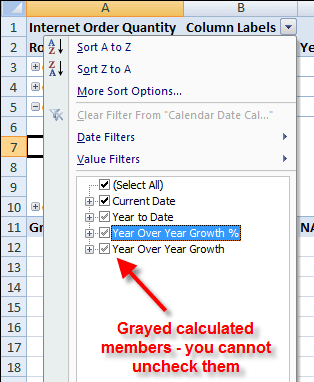
Unfortunately, we cannot select single members from the Calendar Date Calculations attribute. We only have an “all or nothing” option based on the PivotTable Options settings we’ve seen above. This is the resulting Excel 2007 PivotTable.
The solution
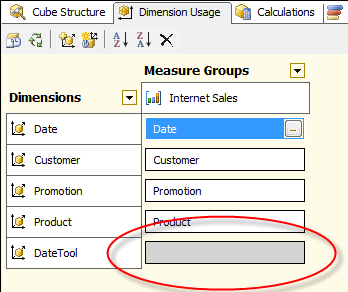
I defined a dedicated dimension for time-related calculated members. Each formula has its own “real” members, instead of calculated ones. This solves the Excel 2007 issue at the price to require a dimension process instead of a simple MDX deployment (changing MDX Scripts for new calculated members wouldn’t require cube reprocessing). Since I don’t want a cube space growth, I simply put the dimension in the cube without a relationship with any measure group.
This is the real tricky and most non-intuitive part of the game. The DateTool dimension is seen as a regular dimension by any client, but it can be changed and reprocessed without any need to reprocess any measure group (because it has no relationship!).
The DateTool dimension could contain a single attribute with all time-related calculated members. However, I prefer an approach that uses two sets of different calculated members, which are orthogonal and might be crossed together. For example, I would put Year-To-Date calculation in one attribute and Year-Over-Year Growth in another one, so that I can obtain the Year-Over-Year Growth of a Year-To-Date calculation without the need to create a dedicated calculated member. In other words, I use these two sets to separate aggregations from comparisons formulas.
In practice, I would need two independent dimensions, and I do that from a relational point of view. I define two views in a separate schema on my data source (I could also use a separate Data Source View with self-contained named queries, but I prefer using relational views as a general way to decouple relational schema from multidimensional one – reasons for this would fill a whole dedicated article).
CREATE SCHEMA DateTool
GO

CREATE VIEW [DateTool].[DateAggregation] AS
SELECT 0 AS ID_Aggregation, 'Regular' AS Aggregation
UNION ALL
SELECT 1 AS ID_Aggregation, 'Year To Date' AS Aggregation
UNION ALL
SELECT 2 AS ID_Aggregation, 'Last 12 Months' AS Aggregation
UNION ALL
SELECT 3 AS ID_Aggregation, 'Total Current Year' AS Aggregation
GO

CREATE VIEW [DateTool].[DateComparison] AS
SELECT 0 AS ID_Comparison, 'Regular' AS Comparison
UNION ALL
SELECT 1 AS ID_Comparison, 'Previous Year' AS Comparison
UNION ALL
SELECT 2 AS ID_Comparison, 'Diff. Over Previous Year' AS Comparison
UNION ALL
SELECT 3 AS ID_Comparison, 'Diff. % Over Previous Year' AS Comparison
GO
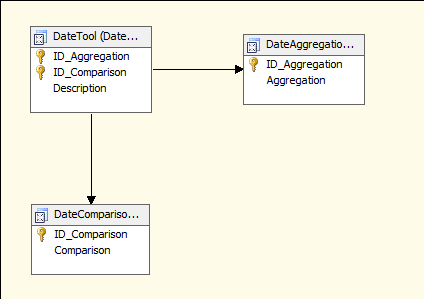
Since I want to build a single dimension with two attributes, I create another view to build a junk dimension with the desired cardinality.
CREATE VIEW [DateTool].[DateTool] AS
SELECT
    a.ID_Aggregation,
    s.ID_Comparison,
    CAST( ID_Comparison AS VARCHAR ) + ' - ' + CAST( ID_Aggregation AS VARCHAR ) AS Description
FROM DateTool.DateAggregation a
CROSS JOIN DateTool.DateComparison s
GO
At this point I can import these views in the Data Source View. I specify Primary Keys and Relationships manually because they can’t be inferred by relational metadata (they don’t exist at that level).
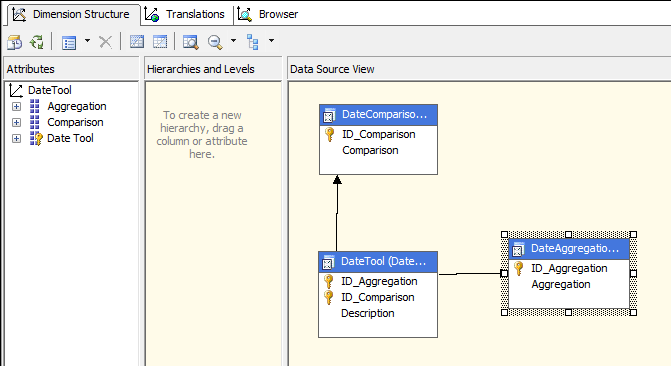
The resulting DateTool dimension is very simple.
At this point there is the necessary MDX Script that solves all DateTool members. This single part would require another post or two and I don’t have time to explain that now, but you can see the complete AdventureWorks based solution downloading it from SQLBI.EU.
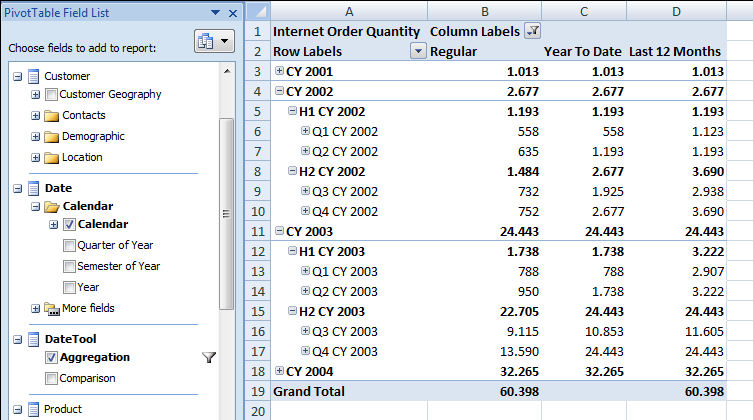
The interesting part is the result provided by Excel 2007 with this solution. Here is an example of the Calendar hierarchy crossed with a selection of the calculated members available in the Aggregation attribute of the DataTool dimension.
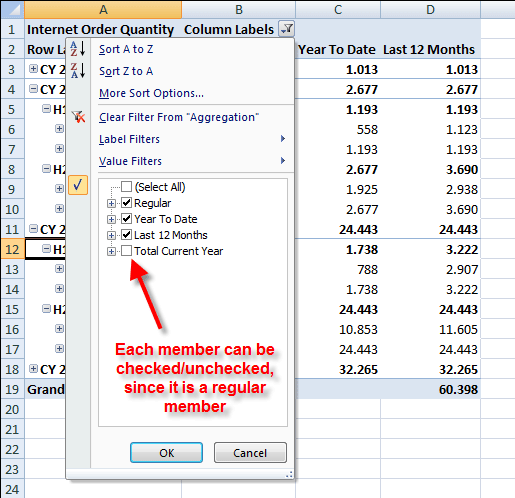
With this dimension, there are no limitations like those involved by calculated members (see the previous example made using Time Intelligence Wizard). In the previous PivotTable there is a member unchecked, like you can see in the following picture.
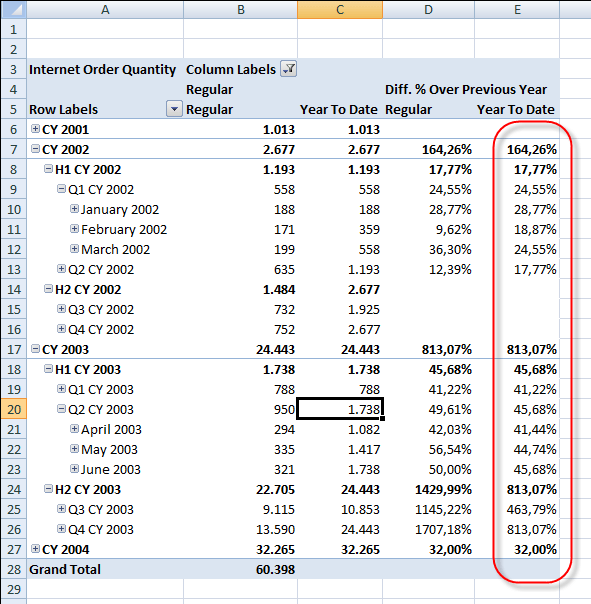
Just using this technique you could translate each calculated measure generated by Time Intelligence Wizard into a “regular” dimension fully usable by Excel 2007 users. The presence of two independent attributes makes the user able to build more complex PivotTables like the following one: the highlighted column displays the Year Over Year Growth over the Year To Date value.
Undoubtedly, such a feature is comfortable more to advanced users that to inexperienced one, since often a rename of the resulting report is required to better describe query results.
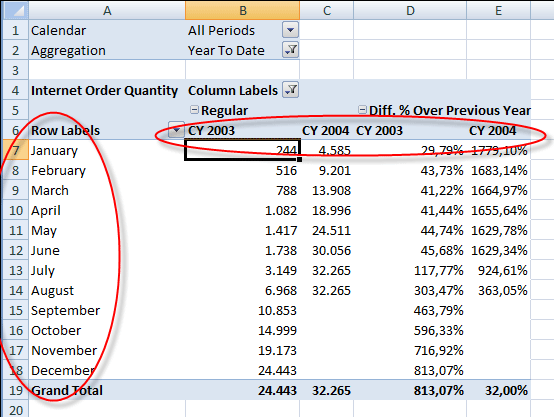
Finally, one of the limitations of Time Intelligence Wizard is that generated formulas work on a limited part of the cube: only one time hierarchy and only a selected set of measures. With the MDX Scripts I used, there are no similar constraints, making the cube easier to navigate. In the following example, I put years on columns and months on rows, displaying the Year-To-Date value and the difference with the previous year for selected data.
Unfortunately, with this approach we lose compatibility with other clients, like the Browser provided by BIDS and SQL Server Management Studio. A PivotTable like the previous one would not display any data: the different way Excel 2007 and OWC 11 manage dimensions metadata produces this discrepancy between results obtained by difference OLAP clients. I am not sure if this can be solved just changing MDX Scripts definition – I made many tests until now and I described the best compromise I obtained until now, but I’d like to get feedback about issues, possible improvements and eventually alternative architectural solutions.
If you have time to take a look at the solution, please write your feedback using the comments.
 Marco Russo