 Marco Russo
Limitations of SUMMARIZE
The SUMMARIZE function in DAX is a powerful one, but – at the same time – it is also hard to use. It can be used to perform grouping and joins between tables, as we previously described in the Grouping Data article. Unfortunately, it has some well-known performance issues when computing aggregated values. It is worth to remember that you should always follow the patterns described in Best Practices Using SUMMARIZE and ADDCOLUMNS. We also wrote a more detailed analysis of internal behaviors in All the secrets of SUMMARIZE.
Besides performance, a computational limit of SUMMARIZE is that it cannot aggregate values calculated dynamically within the query itself.
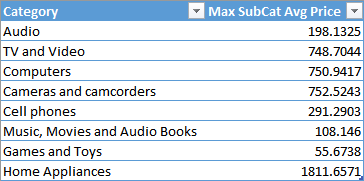
For example, consider the following query, which should return, for each product category, the maximum value of the average price of the related subcategories.
EVALUATE
ADDCOLUMNS (
    SUMMARIZE (
        ADDCOLUMNS (
            SUMMARIZE (
                Product,
                'Product Category'[Category],
                'Product Subcategory'[Subcategory]
            ),
            "Average Price", CALCULATE ( AVERAGE ( Product[Unit Price] ) )
        ),
        'Product Category'[Category]
    ),
    "Max SubCat Avg Price", CALCULATE ( MAX ( [Average Price] ) )
)
If you run this query, you will get an error computing MAX ( [Average Price] ). The reason is that in DAX you can only aggregate physical columns. In fact, remember this equivalence:
MAX ( table[expression] ) = MAXX ( table, table[expression] )
If you try to aggregate a column calculated within the query (such as the Average Price column of this example), the engine is not able to find a corresponding MAXX function, so you get an error as a result. You can obtain the desired result by rewriting the query avoiding the nested SUMMARIZE calls.
EVALUATE
ADDCOLUMNS (
    VALUES ( 'Product Category'[Category] ),
    "Max SubCat Avg Price", CALCULATE (
        MAXX (
            ADDCOLUMNS (
                SUMMARIZE (
                    Product,
                    'Product Category'[Category],
                    'Product Subcategory'[Subcategory]
                ),
                "Average Price", CALCULATE ( AVERAGE ( Product[Unit Price] ) )
            ),
            [Average Price]
        )
    )
)
This query generates the following result:
Besides its verbosity, this approach is not efficient. If you want to compute both minimum and maximum average price, you would duplicate the internal SUMMARIZE, requiring a longer execution time.
GROUPBY instead of SUMMARIZE
The new DAX introduces the GROUPBY function, which has a syntax similar to SUMMARIZE, even if its semantic is a different one. In fact, it solves the issues we had in SUMMARIZE when grouping values, so you can avoid the pattern ADDCOLUMNS/SUMMARIZE described in this article and only rely on GROUPBY.
However, even with GROUPBY, you cannot use the syntax we have seen at the beginning, because the limitation of aggregating an internally calculated column still exists. You have to use a new function, CURRENTGROUP, which enables the access to the internal group, so you have the table argument for an aggX function and you can access the computed column through the row context in this way.
EVALUATE
GROUPBY (
    ADDCOLUMNS (
        GROUPBY (
            Product,
            'Product Category'[Category],
            'Product Subcategory'[Subcategory]
        ),
        "Average Price", CALCULATE ( AVERAGE ( Product[Unit Price] ) )
    ),
    'Product Category'[Category],
    "Max SubCat Avg Price", MAXX ( CURRENTGROUP (), [Average Price] )
)
You have to use CURRENTGROUP within the GROUPBY call, so you cannot use the ADDCOLUMNS function wrapping the GROUPBY results to add new columns computed in this way. You can get rid of ADDCOLUMNS only if you explicitly write the calculation without using CALCULATE or referencing a measure: these operations are not allowed within GROUPBY (currently the only supported use is calling CURRENTGROUP within an aggregation function), so you still have to rely on ADDCOLUMNS in case you want a filter context. Thus, you can use the following syntax without the ADDCOLUMNS function to compute the Average Price column.
EVALUATE
GROUPBY (
    GROUPBY (
        Product,
        'Product Category'[Category],
        'Product Subcategory'[Subcategory],
        "Average Price", AVERAGEX ( CURRENTGROUP() , Product[Unit Price] )
    ),
    'Product Category'[Category],
    "Max SubCat Avg Price", MAXX ( CURRENTGROUP (), [Average Price] )
)
GROUPBY Result Removes Blank Results
The result of GROUPBY automatically removes rows that have a blank result in the column that contains CURRENTGROUP in the expression evaluated. The result is intuitive most of the times, removing those “blank rows” from the result, but it could be counter-intuitive when you mix calculations working with CURRENTGROUP to other that do not use it.
For example, consider the following query, which computes only average prices higher than 500, and also returns the length of the Product Category name in another column.
EVALUATE
GROUPBY (
    GROUPBY (
        Product,
        'Product Category'[Category],
        'Product Subcategory'[Subcategory],
        "Average Price", AVERAGEX ( CURRENTGROUP (), Product[Unit Price] )
    ),
    'Product Category'[Category],
    "Max SubCat Avg Price", MAXX (
        CURRENTGROUP (),
        IF ( [Average Price] > 500, [Average Price], BLANK () )
    ),
    "Len", LEN ( 'Product Category'[Category] )
)
The result only includes product categories with at least one subcategory having an average price higher than 500, despite the fact that the length of product name can be computed for all the categories.
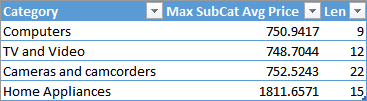
UPDATE 2022-07-26: The behavior of GROUPBY in Power BI and Azure Analysis Services (2022) is now different and the rows included in the result also have the blank result for the Max SubCat Avg Price column. If you want to get rid of the blank rows, you should use FILTER over the result of GROUPBY and exclude the rows you do not want to see.
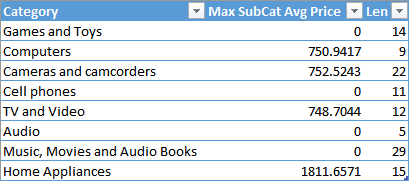
If you need to display the value, simply replace BLANK() with 0 in the values that are aggregated in the MAXX function.
EVALUATE
GROUPBY (
    GROUPBY (
        Product,
        'Product Category'[Category],
        'Product Subcategory'[Subcategory],
        "Average Price", AVERAGEX ( CURRENTGROUP (), Product[Unit Price] )
    ),
    'Product Category'[Category],
    "Max SubCat Avg Price", 0 + MAXX (
        CURRENTGROUP (),
        IF ( [Average Price] > 500, [Average Price], 0 )
    ),
    "Len", LEN ( 'Product Category'[Category] )
)
In this way, you obtain a result that includes all the product subcategories.
IMPORTANT (UPDATE 2022-07-26): The function GROUPBY is intended to be used only with CURRENTGROUP, so using other expressions might produce unexpected result. Indeed, Microsoft changed the behavior of GROUPBY for expressions not including CURRENTGROUP, which are now not supported in DAX. Thus, instead of LEN ( ‘Product Category'[Category] ) in the previous code, you should use an aggregation such as MAXX ( CURRENTGROUP(), LEN ( ‘Product Category'[Category] ) ).
Moreover, from a performance point of view, GROUPBY does not take advantage of VertiPaq and materializes the rows to be grouped by the formula engine. Thus, GROUPBY should be used only to group the result of another calculation already materialized (such as the result of a SUMMARIZE function).
Conclusion
You should consider using GROUPBY instead of ADDCOLUMNS/SUMMARIZE whenever you want to access the rows of a group in an iterator. This is necessary whenever you have nested grouping operations. You can use SUMMARIZE in the innermost group, but you have to use GROUPBY in order to access to columns calculated in an inner grouping function.
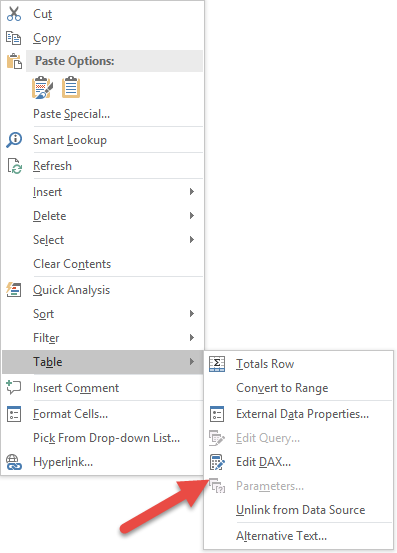
You can download the sample file that includes the data model (Product, Product Subcategory, and Product Category tables) and the same queries described in this article. Each query is in an Excel table and you can edit the DAX query using the context menu you see in the following picture, or you can use DAX Studio, too.
Creates a summary of the input table grouped by the specified columns.
SUMMARIZE ( <Table> [, <GroupBy_ColumnName> [, [<Name>] [, [<Expression>] [, <GroupBy_ColumnName> [, [<Name>] [, [<Expression>] [, … ] ] ] ] ] ] ] )
Returns the largest value in a column, or the larger value between two scalar expressions. Ignores logical values. Strings are compared according to alphabetical order.
MAX ( <ColumnNameOrScalar1> [, <Scalar2>] )
Returns the largest value that results from evaluating an expression for each row of a table. Strings are compared according to alphabetical order.
MAXX ( <Table>, <Expression> [, <Variant>] )
Creates a summary the input table grouped by the specified columns.
GROUPBY ( <Table> [, <GroupBy_ColumnName> [, [<Name>] [, [<Expression>] [, <GroupBy_ColumnName> [, [<Name>] [, [<Expression>] [, … ] ] ] ] ] ] ] )
Access to the (sub)table representing current group in GroupBy function. Can be used only inside GroupBy function.
CURRENTGROUP ( )
Returns a table with new columns specified by the DAX expressions.
ADDCOLUMNS ( <Table>, <Name>, <Expression> [, <Name>, <Expression> [, … ] ] )
Evaluates an expression in a context modified by filters.
CALCULATE ( <Expression> [, <Filter> [, <Filter> [, … ] ] ] )
Returns a table that has been filtered.
FILTER ( <Table>, <FilterExpression> )
Returns a blank.
BLANK ( )
Returns the number of characters in a text string.
LEN ( <Text> )