introducing the option of extracting data from the PowerPivot data model to an Excel table, which you can then import into the PowerPivot data model again after applying some Excel calculation. We call this a linkback table. In this article, you will see how to use this interesting feature in Excel 2013.
How to create a Linkback table
First, I want to mention the blog post from Kasper De Jonge that presented for the first time the feature that enables writing a DAX query in order to extract data from the data model. Assume you imported a few tables from Adventure Works in an Excel 2013 data model. In the sample workbook you can download at the end of this article, you will find data loaded using some SQL views, which are useful to adjust table and column names used.
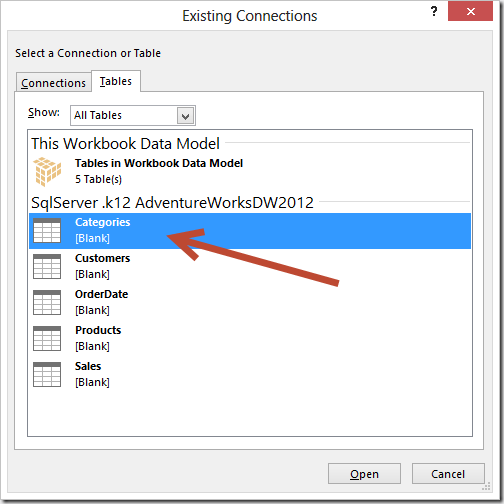
Other than creating a PivotTable from the data model, you can also import in Excel the entire content of a table in the PowerPivot data model. You select the Connections button in the Data Ribbon and in the Existing Connections dialog box you select the Tables tab, choosing the table you want from the data model. For example, the following picture shows the selection of the Categories table.
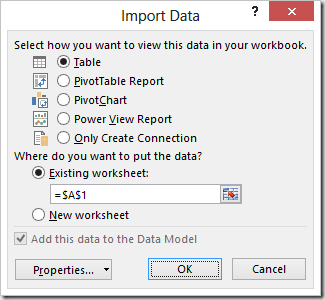
Once you click Open, you select Table in the Import Data dialog box.
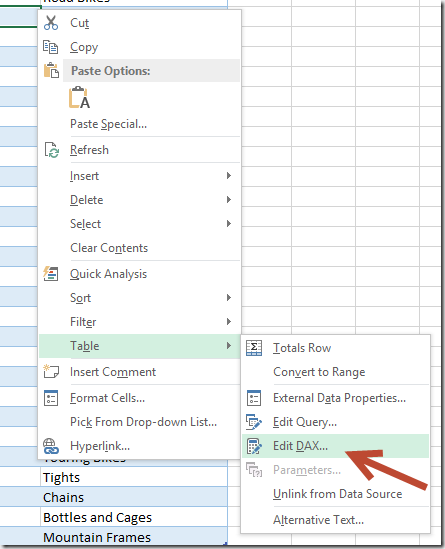
After you click OK, you obtain a table in Excel that contains a copy of the data you have also in the PowerPivot data model. At this point, this might seem useless and a waste of space. However, what you have now is a query to the data model that just return the entire content of a table, but you can change this query by right-clicking on the Excel table and choosing the Edit DAX command in the Table context menu.
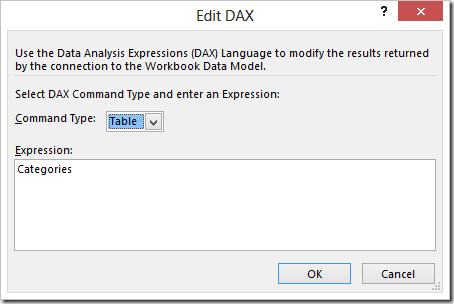
The Edit DAX dialog box shows you a Command Type combo box set to Table.
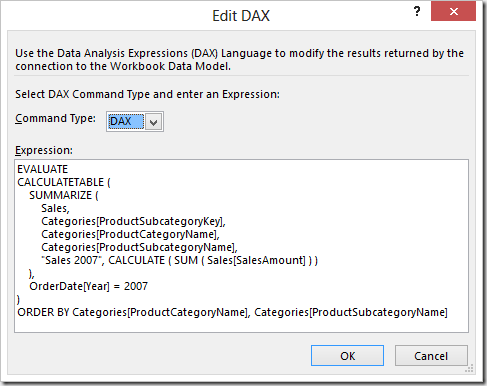
If you change the Command Type to DAX, you can insert a DAX query. For example, in the next picture you can see a query that returns the total sales for 2007 for each Category and Subcategory of products. You will use this data as a starting point to define the sales budget for 2008. You can also specify an ORDER BY condition that will be respected in the data imported in Excel: you can always sort data locally to Excel later, but in this way you do not have to worry about that, because the result of the query is imported in the requested sort order in Excel.
We call the table you imported in this way a Reverse Linked Table. After all, it is the opposite of a linked table, because instead of moving data from an Excel table to PowerPivot (this would be a linked table), we are copying data from PowerPivot to an Excel table.
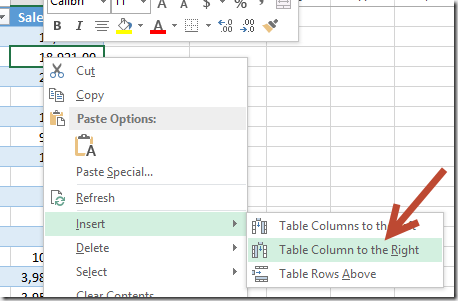
You can extend the table imported from this query by adding columns, just as any Excel table, by selecting the Insert / Table Column to the Right context menu on Sales 2007 column.
You can use Excel formulas or arbitrary values in the resulting table. It is important to note that you can reference other columns in your Excel expression, and you can use a different expression for every cell. This is an important difference compared to a calculated column in PowerPivot, which would have the same expression for all the rows of the table. Another important point is that if you Refresh this table, the underlying DAX query is executed again but the added columns and their expressions are preserved – just be careful and avoid using the automatic propagation of a formula in all the cells of a column, because that would overwrite any other formula as you apply a Refresh.
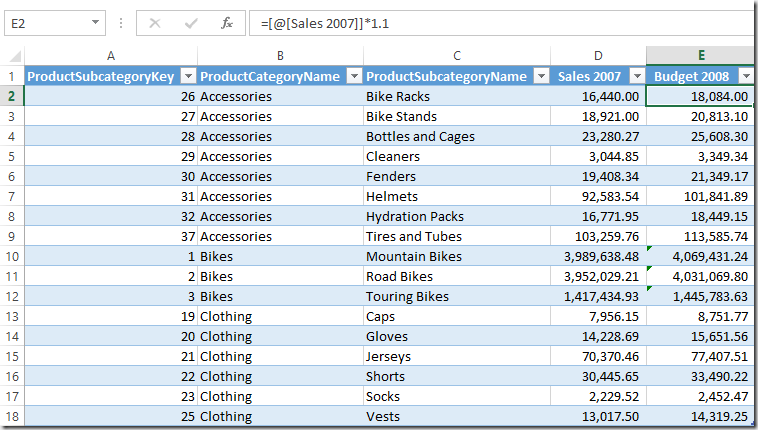
By following these recommendations, you are not going to lose any data when your apply a Refresh. In the following example, you name the new column as Budget 2008 and you write an Excel formula that increases each Subcategory by 10%, except those belonging to Bikes Category that you increase only by 5% (you use a different formula just for these Subcategories).
Now you can rename this table to Budget and then select the Add to Data Model button in the PowerPivot ribbon. From the point of view of PowerPivot, this is just another Linked Table, but because it has been generated extracting data from PowerPivot with a Reverse Linked Table, we call it a Linkback Table.
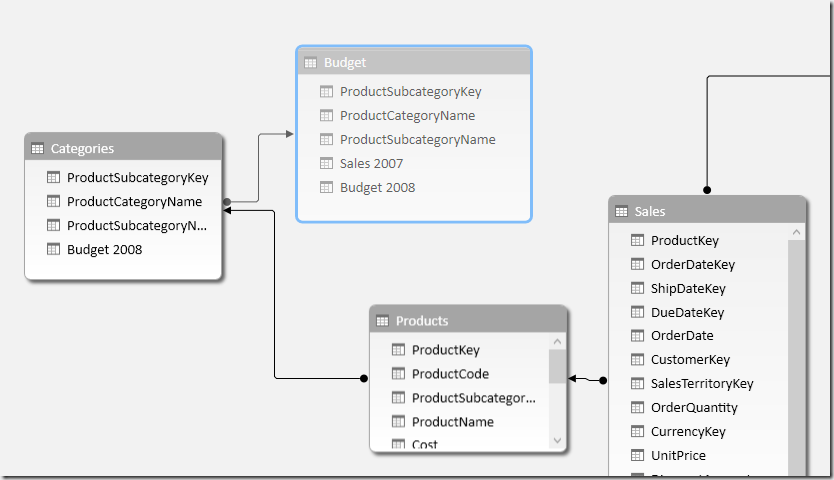
Once imported as a linked table, in the diagram view you define a relationship between Categories and Budget tables using the ProductSubcategoryKey column and you hide the Budget table from the client tool.
In order to make the budget visible, you create a Budget 2008 calculated column in the Categories table by using a DAX expression that reads the corresponding value from the same column in the Budget table.
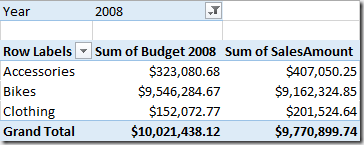
Now you can use this new column in a PivotTable, for example by comparing Budget and SalesAmount values for year 2008.
Definitions and Refresh Order
In this article we introduced a few definitions in order to avoid confusion with the generic Linked Table term. We use the following definitions:
- Linked Table (Excel –> PowerPivot): is an Excel table that is added to the PowerPivot Data Model and is automatically refreshed.
- Reverse Linked Table (PowerPivot –> Excel): is the result of a DAX query imported in an Excel Table. The Refresh of this table executes the DAX query again. If you Refresh all of the data connections in an Excel workbook, a Reverse Linked Table is refreshed after the tables in the PowerPivot data model have been refreshed; in other words, the dependency order for refresh is automatically handled by Excel 2013.
- Linkback Table (PowerPivot –> Excel –> PowerPivot): is a Linked Table that originates from a Reverse Linked Table, which might have been extended adding new columns filled with constants and/or Excel formulas.
The refresh order in a Refresh All operation is typically well handled by Excel and PowerPivot as soon as only one refresh is required for every table. There could be particular conditions requiring your attention, which are described in the remaining part of this article. So you can continue the read in you want to understand the internal behavior of Refresh, otherwise you can skip to the end and start playing with Linkback tables in Excel 2013!
Inside Refresh Order
In case you have a Reverse Linked Table that uses some data coming from a Linkback table, you might have a loop that could require two or more refreshes in order to get data correctly. For example, consider the following scenario:
- You import a table T1 from SQL Server; such a table contains columns A, B and C1.
- You create a reverse linked table T2 using a DAX query on T1 table by summing C1 column (resulting column will be called C2) and grouping data by B column.
- You create a linkback table by adding the T2 table to the data model.
- You define a relationship between T1 and T2 by using the B column.
- You create a calculated column in the T1 table using a DAX expression that references the T2 linkback table. For example, you create a column C2 with the DAX expression RELATED( T2[C2] ).
- You modify the DAX expression in T2 by adding a D column that depends on T1[C2].
- You create a PivotTable using data from T1 and T2.
You might think that, at this point, a circular reference is happening between T1 and T2. In reality, there is no circular reference, because there is no loop between the same columns, but the linkback table T2 might be updated on the Excel workbook without being updated in the PowerPivot data model. In fact, what automatically happens when you Refresh All is:
- T1 is updated in the Data Model from SQL Server
- T2 is updated in Excel from the Data Model
- T2 is updated in the Data Model (Linkback table is updated)
- Calculated columns in T1 are refreshed
- T2 might be updated again in Excel from the Data Model
- PivotTable in Excel using T1 and T2 is refreshed correctly
- T2 in Data Model does not contain the same content as T2 in Excel, until you refresh such a table again
Of course, it is better to avoid calculation dependencies with circular references between tables, even if not between columns. If you have such a situation, the obvious workaround is to request data refresh two or more times, until results stabilize. However, it is a best practice trying to avoid this situation by designing calculation in a linear way, using different tables for each step when possible.
 Marco Russo