 Marco Russo & Alberto Ferrari
Value filter behavior controls the SUMMARIZECOLUMNS behavior that changes how filters are applied to the measure evaluation. This is mostly relevant when developers use the filter arguments in SUMMARIZECOLUMNS.
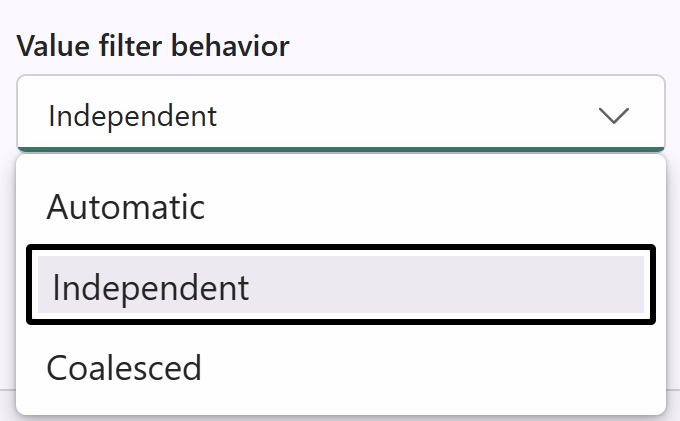
The topic is very broad, and we will just be able to scratch the surface here. However, the good news is that most developers do not need to learn the intricacies of value filter behavior. This property has three settings: Automatic, Independent, and Coalesced. The safest and most correct setting is the one introduced in 2025: Independent. Coalesced was the default setting before 2025, whereas Automatic retains Coalesced for older models, and it sets Independent for new models.
To stay on the safe side, set the value filter behavior to Independent on your models. Your models will work fine, and you will never regret that choice. If you want to learn more about this setting, continue reading. This article will likely not be enough to satisfy your thirst for knowledge; if that is the case, you can delve deeper into the Understanding SUMMARIZECOLUMNS whitepaper available to SQLBI+ subscribers.
Introduction
There are multiple scenarios where the interaction between value filter behavior and auto-exists can be troublesome, and none of them are simple. In this article, we aim to present a scenario that provides a general sense of this complexity, to help understand the suggested best practice: use Independent.
First, we need to state several facts about our sample database:
- Datum is a brand that only sells products in the “Cameras and camcorders” category.
- There are 132 products with the brand “A. Datum”.
- There are 372 products in the “Cameras and camcorders” category.
These numbers will be helpful later. There is no need to remember them; we will recall their value when needed.
We are going to use two measures. The # Products measure computes the number of products. And All Brands computes the number of products by removing any filter from the Product[Brand] column:
# Products = COUNTROWS ( 'Product' )

All Brands =
CALCULATE (
    [# Products],
    REMOVEFILTERS ( 'Product'[Brand] )
)
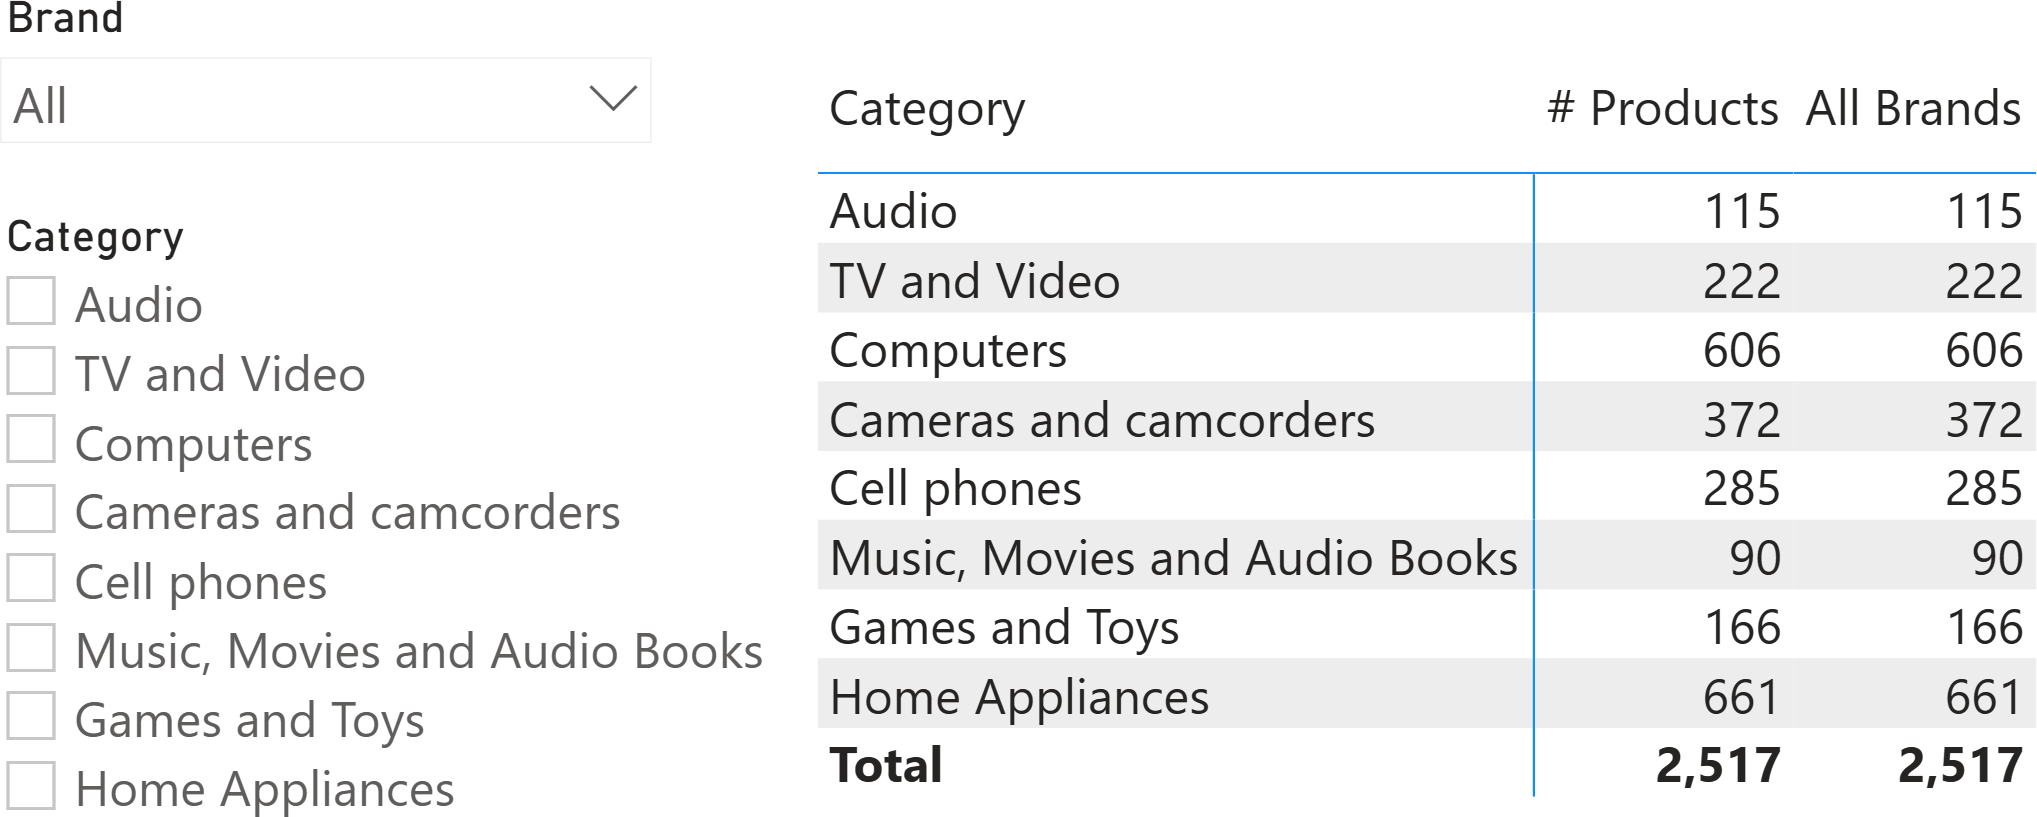
If used in a matrix with two slicers that, for now, are not filtering anything, the two measures produce the same result.
Understanding value filter behavior
There is nothing complex about the matrix. However, it is interesting to see what happens if we use the slicer on Product[Brand] to filter A. Datum only. The numbers are now more complex to interpret, to the point that you might think there is a bug somewhere in your code.
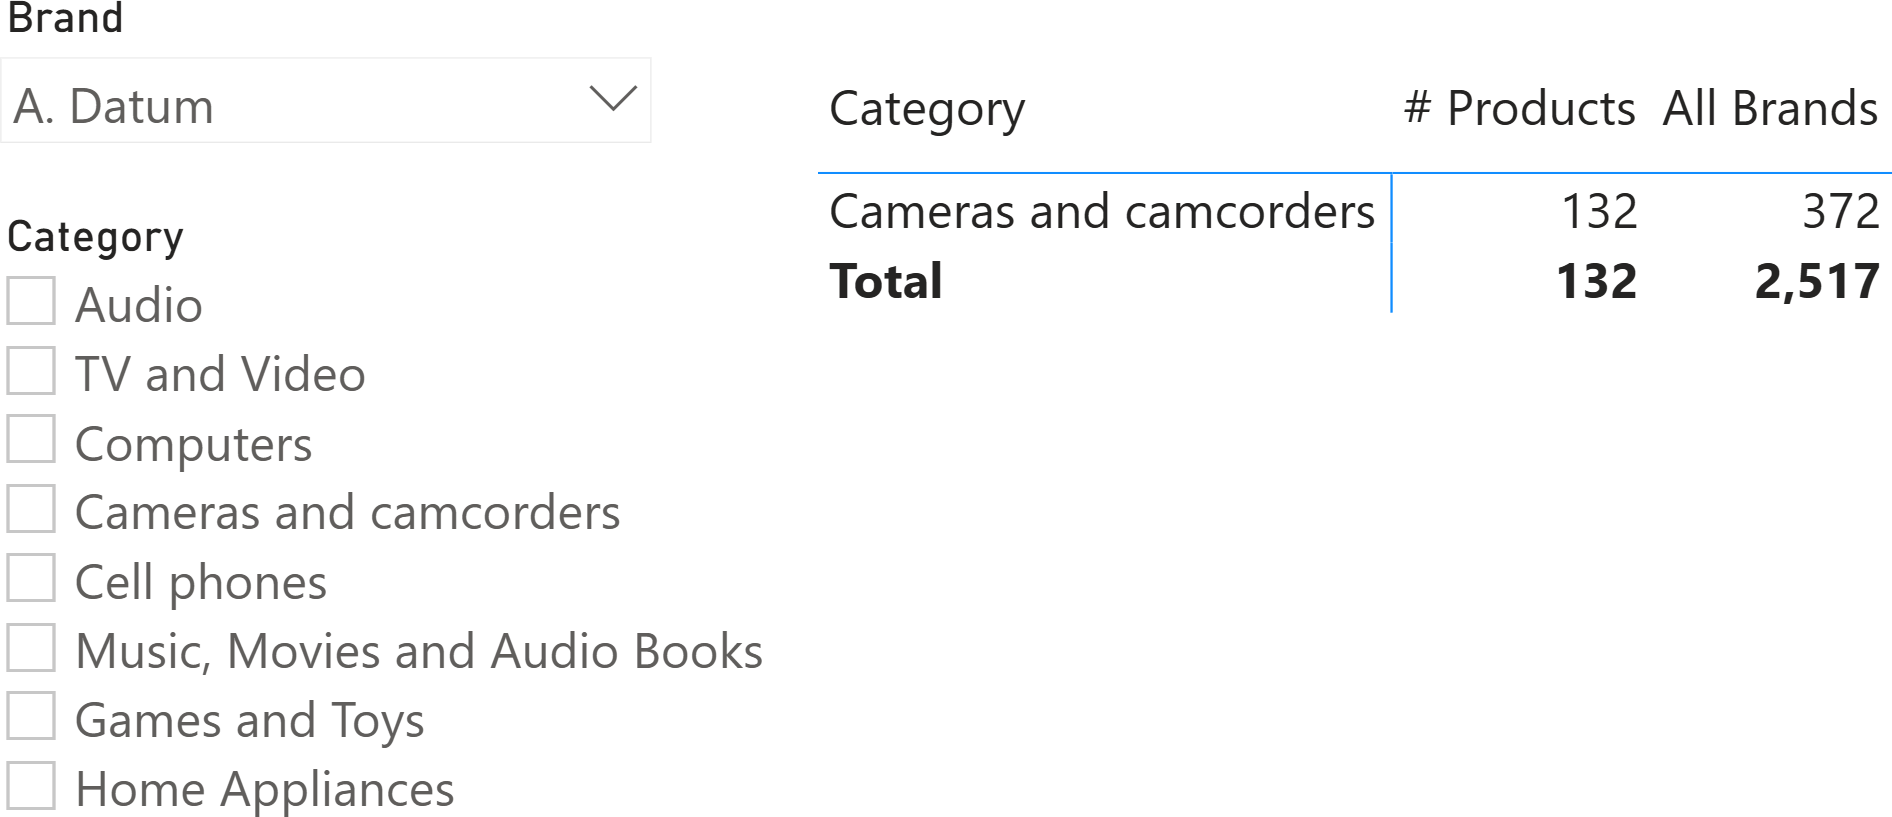
Despite looking incorrect, the numbers produced at the total level make sense. It is not entirely clear because of auto-exists, but the numbers are correct. Let us elaborate on this by first looking at the query being executed:
EVALUATE
SUMMARIZECOLUMNS (
    ROLLUPADDISSUBTOTAL (
        ROLLUPGROUP ( 'Product'[Category], 'Product'[Category Code] ),
        "IsGrandTotalRowTotal"
    ),
    TREATAS ( { "A. Datum" }, 'Product'[Brand] ),
    "# Products", [# Products],
    "All Brands", [All Brands]
)
Before moving further forward, it is helpful to recap the behavior of SUMMARIZECOLUMNS. SUMMARIZECOLUMNS first determines the group-by tuples, which are the rows it will produce. Once the group-by tuples have been determined, SUMMARIZECOLUMNS proceeds with computing the measures to add. Hence, it first checks which categories to return, and then it calculates the two measures for the only category of “Cameras and camcorders”. Let us elaborate a bit on this.
The filter over Product[Brand] (A. Datum) is effective during the determination of the group-by tuples. Therefore, because it is filtering “A. Datum” only, the group-by tuples contain only one row: “Cameras and camcorders”. Indeed, this is the only category sold by “A. Datum”. Please note that the group-by tuples are computed before evaluating the measures. Therefore, it does not matter that the All Brands measure would compute a value for different categories. There is only one category to evaluate: “Cameras and camcorders”.
When it comes to computing the total level, SUMMARIZECOLUMNS does not place any filter on Product[Category], just because it is the total. Therefore, no group-by tuple is added to the filter context. The filter on Product[Brand] is removed by the All Brands measure, which returns the total number of products across all the brands.
The matrix looks confusing because the rows for the other categories are missing. However, the number is correct, despite being hard to understand.
Things can be more complicated if we filter two categories using the slicer. For example, “Cameras and camcorders” and “Cell phones”. From the group-by tuples point of view, we know the Cell phones category will not appear in the matrix. However, we would expect to see 657 products in total, which is 372 (Cameras and camcorders) plus 285 (Cell phones). This is not what happens: we see only 372 in the total.
Let us look at the query being executed:
EVALUATE
SUMMARIZECOLUMNS (
    ROLLUPADDISSUBTOTAL (
        ROLLUPGROUP ( 'Product'[Category], 'Product'[Category Code] ),
        "IsGrandTotalRowTotal"
    ),
    TREATAS ( { "A. Datum" }, 'Product'[Brand] ),
    TREATAS ( { "Cameras and camcorders", "Cell phones" }, 'Product'[Category] ),
    "# Products", [# Products],
    "All Brands", [All Brands]
)
SUMMARIZECOLUMNS is setting two filters on two columns: Product[Brand] and Product[Category]. However, the two filters undergo a process similar to clustering (also known as auto-exists): they are coalesced into a single filter over both columns. Because “A. Datum” only sells products of the “Cameras and camcorders” category, the tuples present in the filter do not contain any other category. The only row present in the filter is the one with “A. Datum” and “Cameras and camcorders”. This filter is used in two calculations: the group-by tuples and the measures. Hence, removing the filter on Product[Brand] leaves a filter with one column only: “Cameras and camcorders”. The measure is evaluated within this filter and produces 372.
The fact that the two filters are coalesced into a single filter produces an unexpected result. This happens if the value filter behavior is set to Coalesced. Changing the value filter behavior to Independent instructs DAX not to coalesce the filters, but rather to keep them as separate filters. The consequence is that there will be two filters: one for the Product[Brand] column and one for the Product[Category] column. Removing the filter on Product[Brand] does not interfere with the filter on Product[Category].
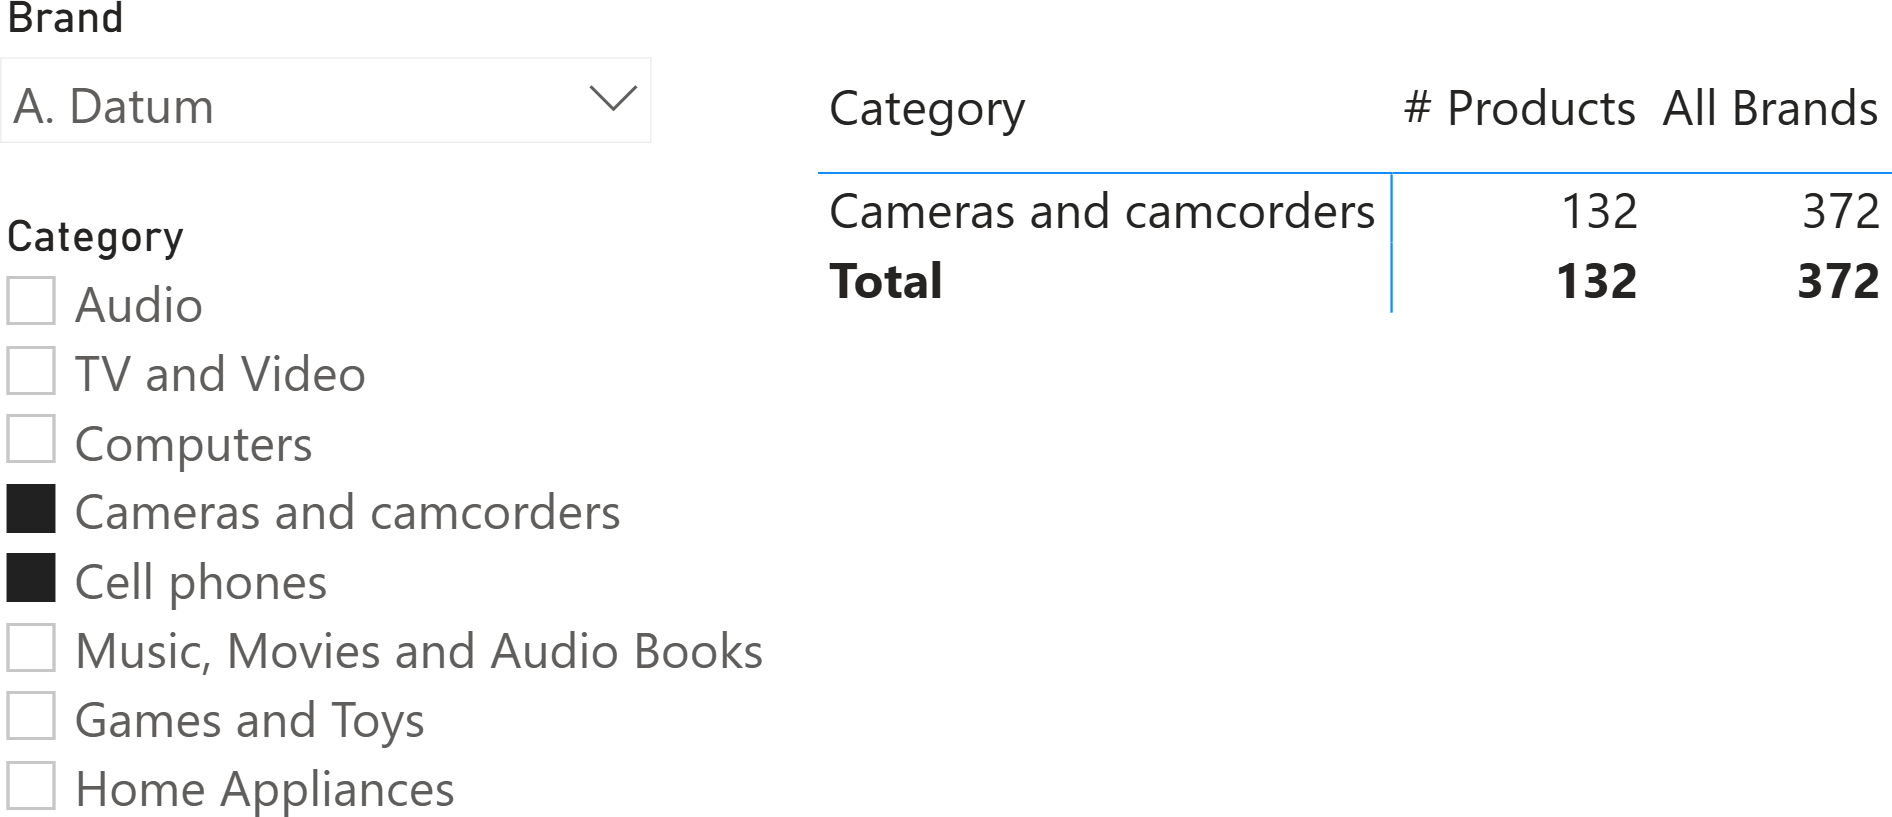
Therefore, setting the value filter behavior in the model to ‘Independent’ produces a much better result for the same report.

The report remains difficult to read due to the missing rows for categories that do not belong to “A. Datum”, but the total of All Brands is correct and represents the total number of products in the two categories selected in the slicer, regardless of their brand.
Conclusions
As we mentioned in the introduction, there are many more scenarios where the difference between Coalesced and Independent yields results that are more intuitive and accurate when using Independent rather than Coalesced. The thing is: using Coalesced always produces results that are much harder to read and understand than using Independent.
Our best advice is to set your models to use Independent and never revert to Coalesced. The Coalesced setting was the only behavior for many years, which is why it is commonly used despite producing results that are hard to understand in complex scenarios.
Still, it is important to acknowledge that changing the Value filter behavior property does not affect auto-exists. SUMMARIZECOLUMNS still generates clustering when it determines the group-by tuples (which is why we only see “Cameras and camcorders”). Value filter behavior only changes the way the filter is applied when computing measures: the group-by tuples still undergo clustering in SUMMARIZECOLUMNS.
Create a summary table for the requested totals over set of groups.
SUMMARIZECOLUMNS ( [<GroupBy_ColumnName> [, [<FilterTable>] [, [<Name>] [, [<Expression>] [, <GroupBy_ColumnName> [, [<FilterTable>] [, [<Name>] [, [<Expression>] [, … ] ] ] ] ] ] ] ] ] )