 Marco Russo & Alberto Ferrari
SUMMARIZECOLUMNS is the most widely-used function in Power BI queries. An important and unique feature of SUMMARIZECOLUMNS is that it determines automatically how to scan the model to produce its result. Indeed, when using SUMMARIZE, GROUPBY, ADDCOLUMNS, or any of the more basic querying functions, developers must declare the source table to perform the grouping, as well as the group-by columns and the measures to add to the result. On the other hand, SUMMARIZECOLUMNS requires only the group-by columns; there is no need to provide the source table, which is the primary ingredient of any query. SUMMARIZECOLUMNS figures out the structure of the result by itself, using a sophisticated algorithm that requires some understanding.
This article is part of a series that describes the features of SUMMARIZECOLUMNS in greater detail. We published a whitepaper for SQLBI+ that contains everything we know about SUMMARIZECOLUMNS. The whitepaper offers more than 50 pages of highly technical content. This series of articles is a simplified version of the full content to introduce these topics to a larger audience.
A first suggestion when using SUMMARIZECOLUMNS, is to set the Value Filter Behavior to Independent, to reduce the effect of auto-exists to only the group-by tuples, thus obtaining a much more consistent behavior in the evaluation of the measures. We will dedicate a whole article to Value Filter Behavior, and it is explained in even further detail in the SQLBI+ whitepaper.
In this article, we focus on the best practices to adopt when using SUMMARIZECOLUMNS in your measures. In the other articles of this series, we will go deeper into some of the details of SUMMARIZECOLUMNS. Hence, in this article, we will not be able to explain the entire rationale behind each best practice.
Why is SUMMARIZECOLUMNS becoming more relevant in DAX?
Although SUMMARIZECOLUMNS has been a DAX function for a long time, most DAX developers are unfamiliar with all its features. The reason is relatively simple: before 2025, SUMMARIZECOLUMNS could not be used in measures. It was used almost exclusively by Power BI to populate visuals. However, because DAX developers author measures rather than queries, and SUMMARIZECOLUMNS could not be used in measures, there was no reason to spend time learning the function.
The reason why SUMMARIZECOLUMNS could not be used in measures is very technical and not interesting to learn, as it no longer exists. In short, SUMMARIZECOLUMNS could not be called from inside an iteration, or another SUMMARIZECOLUMNS. Because measures (in Power BI queries) are almost always executed inside an outer SUMMARIZECOLUMNS, it comes naturally that a measure could not use SUMMARIZECOLUMNS as part of its execution.
The limitation was lifted between 2023 and 2024. In 2025, SUMMARIZECOLUMNS started being able to be used as an alternative to ADDCOLUMNS or SUMMARIZE. However, having the option of doing something does not mean you need to do it. Specifically, SUMMARIZECOLUMNS is extremely intricate in how it creates its results, to the point that we will suggest our readers use only some of its features.
NOTE: Full support of SUMMARIZECOLUMNS is not available in SQL Server Analysis Services until version 2022, and it is not available in Excel at the time of writing. You need at least SQL Server Analysis Services 2025 or a future version of Excel that will support it. There are no issues using a recent version of Power BI.
SUMMARIZECOLUMNS features in short
SUMMARIZECOLUMNS offers several features:
- It performs grouping by any set of columns, without the need to specify the starting table, as is the case with SUMMARIZE or GROUPBY.
- It can perform grouping using limited relationships, a feature not available in the more basic SUMMARIZE.
- It can add filters that are used both in the grouping and in the evaluation of measures.
- It can compute subtotals for columns and/or groups of columns.
- It adds new columns to its output, evaluating DAX expressions in the filter context of the currently-grouped columns.
- It accepts a set of modifiers to change its behavior, like IGNORE and NONVISUAL.
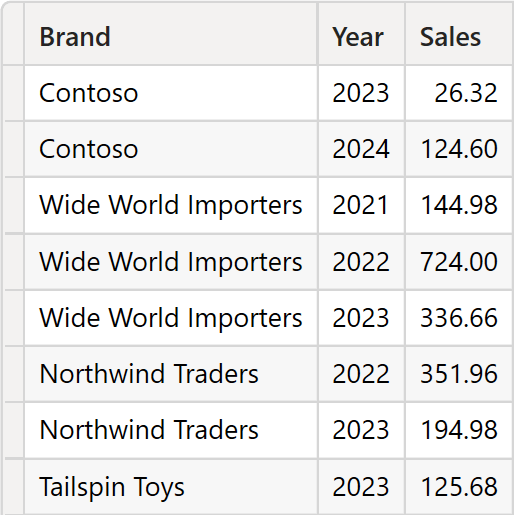
Most of the features of SUMMARIZECOLUMNS can be obtained by combining more basic functions. For example, the following query groups by Product[Brand] and Date[Year], in order to compute the sales amount for only the purple products:
EVALUATE
SUMMARIZECOLUMNS (
    'Product'[Brand],
    'Date'[Year],
    TREATAS ( { "Purple" }, 'Product'[Color] ),
    "Sales", [Sales Amount]
)
Here you can see the result.
The same result, using basic functions, requires a more complex syntax, involving multiple nested functions:
EVALUATE
FILTER (
    CALCULATETABLE (
        ADDCOLUMNS (
            CROSSJOIN ( VALUES ( 'Product'[Brand] ), VALUES ( 'Date'[Year] ) ),
            "Sales", [Sales Amount]
        ),
        TREATAS ( { "Purple" }, 'Product'[Color] )
    ),
    NOT ISBLANK ( [Sales] )
)
Our loyal readers will probably turn up their noses and think that this code is too convoluted. A much simpler formula is the following:
EVALUATE
CALCULATETABLE (
    ADDCOLUMNS (
        SUMMARIZE ( Sales, 'Product'[Brand], 'Date'[Year] ),
        "Sales", [Sales Amount]
    ),
    TREATAS ( { "Purple" }, 'Product'[Color] )
)
However, this latter query is NOT entirely equivalent to the SUMMARIZECOLUMNS version. It is, in this simple case, but it would just not work in a more complex scenario. For example, if the relationship between Sales and Product were a limited relationship, then this latter formula would raise an error, while the previous, more complex formula would work smoothly.
SUMMARIZECOLUMNS has the advantage of combining all the features into one single function, and the disadvantage that – combining all the features in a single function – it displays some very complex behaviors.
Mostly, SUMMARIZECOLUMNS produces the expected results. However, in several scenarios, its automatisms may produce unexpected results. This is why – after a very deep and careful analysis of the function – we created this list of best practices.
SUMMARIZECOLUMNS best practices
SUMMARIZECOLUMNS can be used both to express queries and to create temporary tables inside measures to perform further calculations. The following considerations are valid in both scenarios, even though they are more important for SUMMARIZECOLUMNS used inside measures. This is because a measure should run in any evaluation context, whereas a query typically runs in an empty filter context. For these reasons, measures require more attention to detail.
Because SUMMARIZECOLUMNS is the primary function used by Power BI to populate reports, it has been very well optimized over the years, and that trend is likely to continue. SUMMARIZECOLUMNS performs mostly better than combinations of SUMMARIZE, ADDCOLUMNS, GROUPBY, and other more basic DAX functions.
Hence, it is tempting to consider SUMMARIZECOLUMNS the primary grouping function in DAX and to start using it rather than other, more basic functions. It is compact and fast. However, despite all of its great features, it is also highly complex to understand in some borderline case scenarios.
Therefore, we suggest limiting the use of SUMMARIZECOLUMNS only to more advanced scenarios, and leaving the more basic scenarios to the more regular DAX functions. Let us provide some guidelines about the function to use in different scenarios, when grouping with one or multiple fact tables, and with or without the presence of measures:
- Basic grouping with no measures: use VALUES for one column, SUMMARIZE for models involving only regular relationships, and SUMMARIZECOLUMNS when there are limited relationships.
- Basic grouping with measures: when performing grouping and computing measures over a single fact table, SUMMARIZECOLUMNS is the best option, as it is best optimized. But it is just slightly better than SUMMARIZE and ADDCOLUMNS.
- Complex grouping: when grouping and computing measures from multiple fact tables, SUMMARIZECOLUMNS is your best option as it produces concise and easy DAX code, whereas using SUMMARIZE and ADDCOLUMNS requires complicated DAX code.
- Grouping and filtering: using SUMMARIZECOLUMNS is still a good option, but the filtering part needs to be outside of SUMMARIZECOLUMNS – in an external CALCULATETABLE – to avoid the shenanigans of coalesced filters and group-by columns.
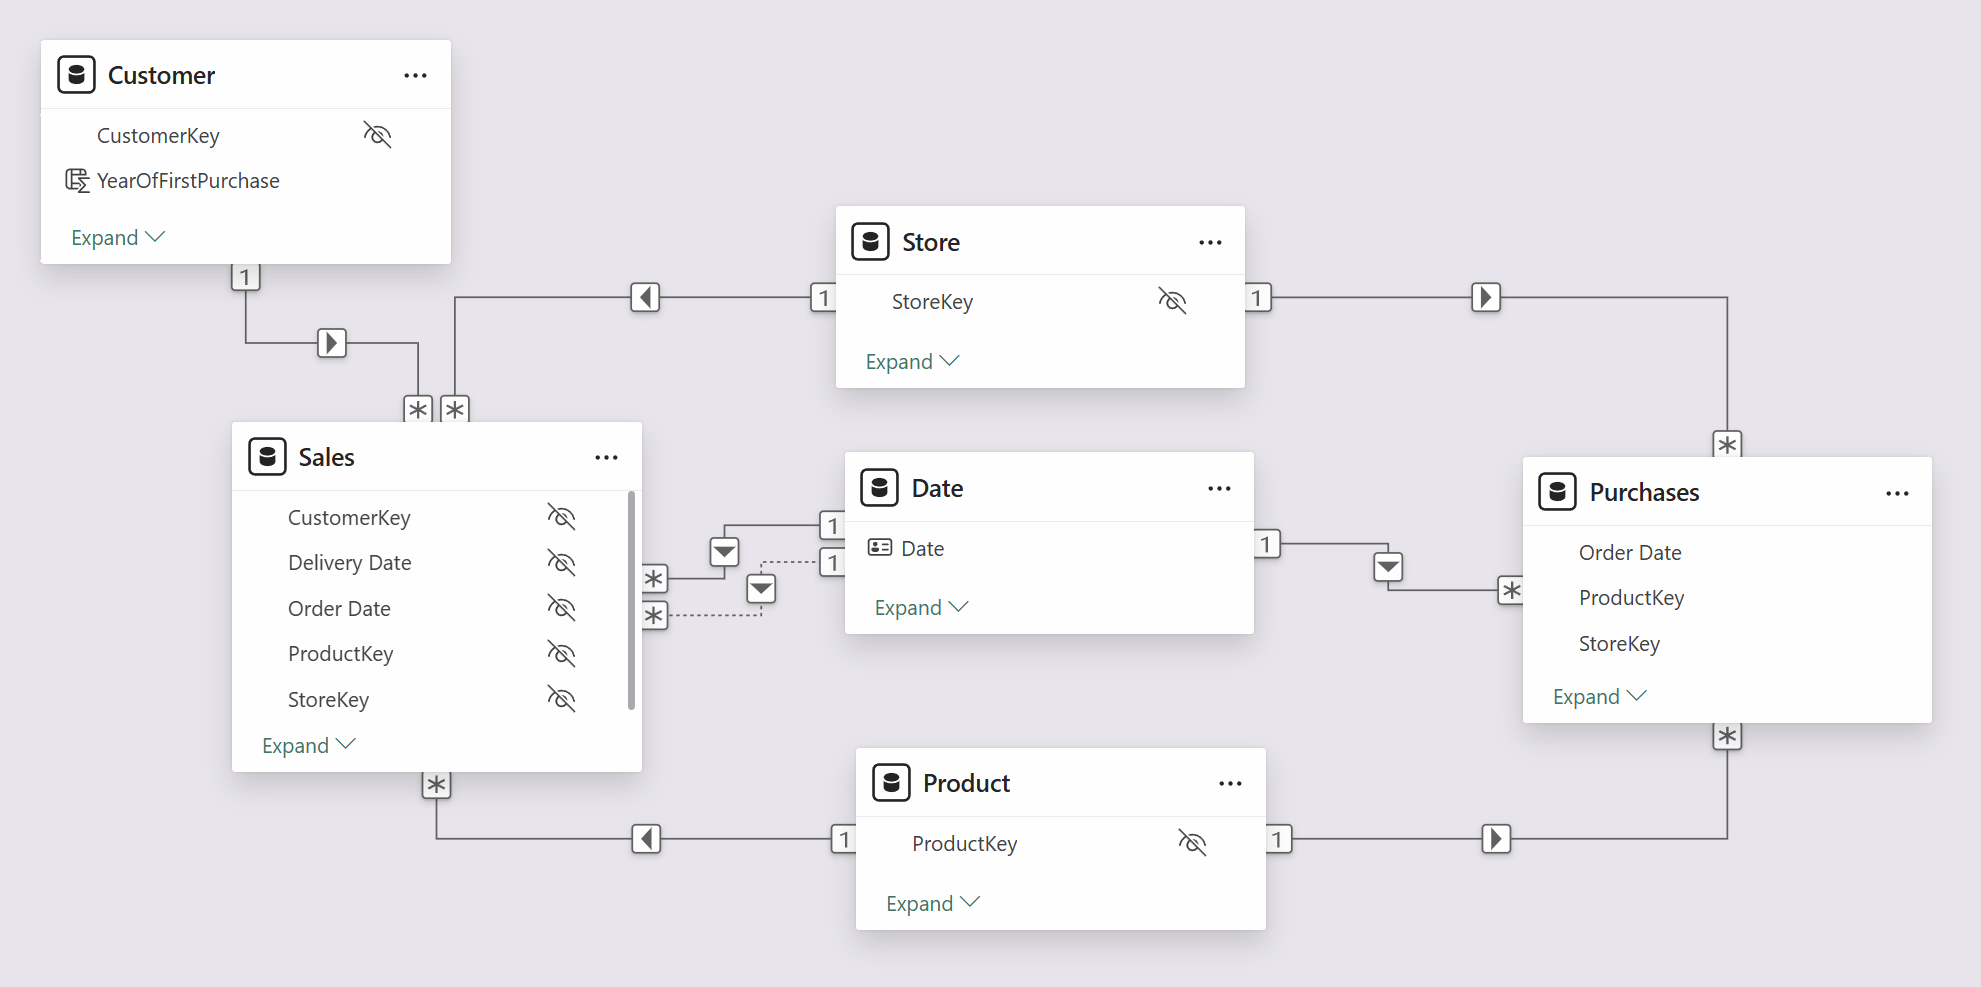
The following sections provide more details about the rationale of each best practice. The examples are based on the following semantic model, where measures aggregate two tables: Sales and Purchases.
Basic grouping, with no measures
When grouping is needed without measures involved, SUMMARIZECOLUMNS is overkill. SUMMARIZE or VALUES work just fine. If you need the values of only one column, VALUES is the way to go. When you need the existing combinations of one set of columns, SUMMARIZE is your best option.
The only scenario where SUMMARIZECOLUMNS should be used to perform grouping is when limited relationships are part of the equation. Indeed, SUMMARIZE lets developers group on any column of the expanded table. If a model includes limited relationships, then table expansion does not happen, and SUMMARIZE is no longer an option. In that scenario, using SUMMARIZECOLUMNS is the preferred option.
Because there are no measures, non-empty is not going to kick in. Hence, you should always use a table to indicate how to execute auto-exists and avoid obtaining the full cross-join of values. The following two queries are equivalent:
EVALUATE
SUMMARIZE (
    Sales,
    Product[Brand],
    Customer[Continent]
)

EVALUATE
SUMMARIZECOLUMNS (
    Product[Brand],
    Customer[Continent],
    Sales
)
While the first query is likely more intuitive, the second, using SUMMARIZECOLUMNS, works the same way, even though we use Sales as a filter rather than as the main group-by table.
Basic grouping, with measures
The most common scenario where SUMMARIZECOLUMNS can be helpful is when you need to perform grouping by some columns and compute a measure, removing empty values at the same time. This scenario covers the vast majority of situations where grouping is needed. As an example, these two queries are almost equivalent:
EVALUATE
FILTER (
    ADDCOLUMNS (
        SUMMARIZE (
            Sales,
            Product[Brand],
            Customer[Continent]
        ),
        "@Sales", [Sales Amount]
    ),
    NOT ISBLANK ( [@Sales] )
)

EVALUATE
SUMMARIZECOLUMNS (
    Product[Brand],
    Customer[Continent],
    "@Sales", [Sales Amount]
)
Before moving further, it is essential to note that the two formulas are not entirely identical. When we use SUMMARIZE, the result includes all the combinations of Brand and Continent referenced by Sales, regardless of the value of the @Sales result. In other words, irrespective of the value of the measure, existing combinations are returned. On the other hand, SUMMARIZECOLUMNS generates the full cross-join of column values, and the measure is in charge of determining which combinations to return. If the measure returns blank, the combination is removed by non-empty, otherwise the combination is returned.
Another relevant difference is how the outer filter operates on the two functions. SUMMARIZE scans Sales, considering all the filters that directly or indirectly affect Sales. SUMMARIZECOLUMNS generates the group-by tuples by ignoring cross-filters and relying on the measure to remove unnecessary combinations through non-empty.
Considering these differences, both SUMMARIZECOLUMNS and ADDCOLUMNS / SUMMARIZE are good options, with a slight preference for SUMMARIZECOLUMNS. Indeed, SUMMARIZECOLUMNS is a well-optimized function, and performance will likely be better with SUMMARIZECOLUMNS rather than ADDCOLUMNS / SUMMARIZE. However, when it comes to performance, extensive testing is always needed. Therefore, we suggest our readers test both scenarios and make an educated choice.
Complex grouping
In scenarios where you need to perform grouping and aggregate values from different fact tables, SUMMARIZECOLUMNS is definitely your best option, as it makes it much easier to build a correct result. To demonstrate this, we added a Purchases table to the model. The Purchases table does not contain any products from the Audio category. Suppose we want to retrieve both sales and purchase amounts while grouping by Product[Category] and Store[Country]. We can achieve this goal with SUMMARIZECOLUMNS:
EVALUATE
SUMMARIZECOLUMNS (
    Product[Category],
    Store[Country],
    "Sales", [Sales Amount],
    "Purchases", [Purchase Amount]
)
ORDER BY
    Product[Category],
    Store[Country]
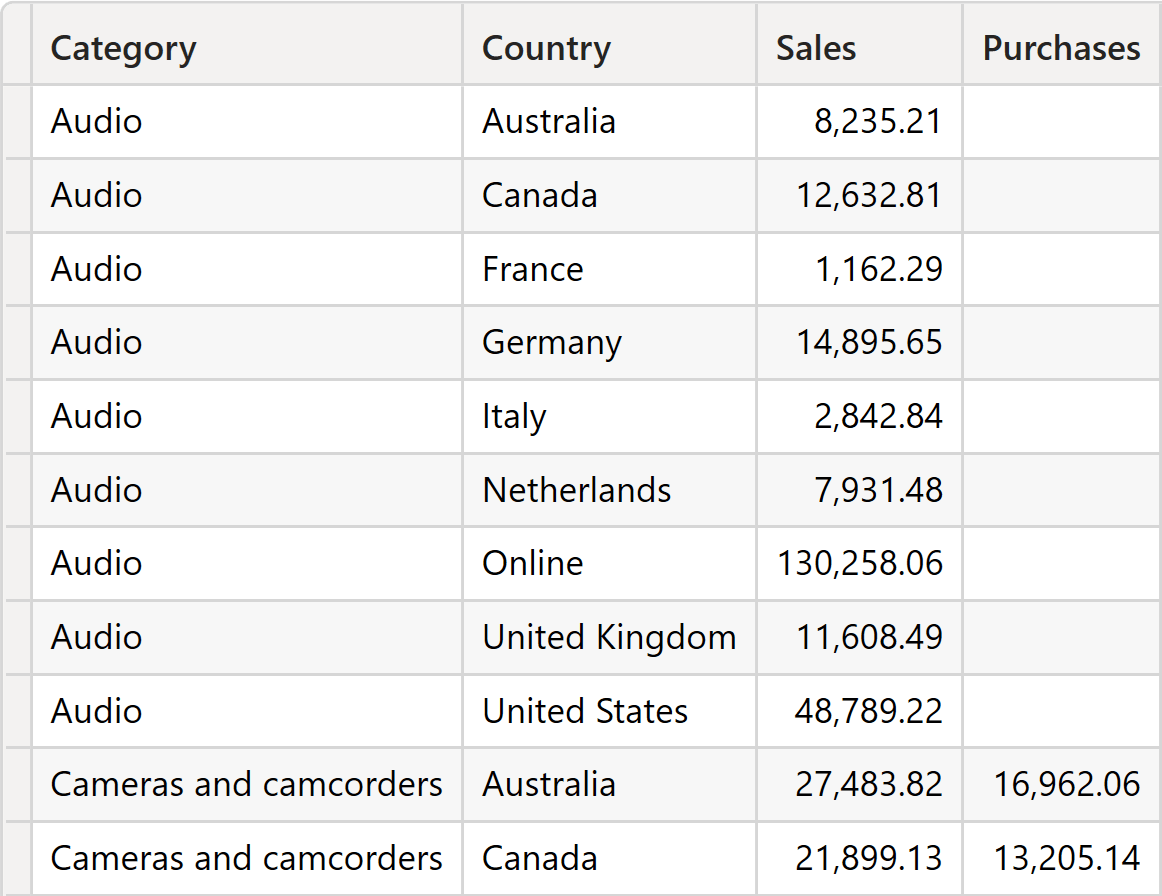
As you can see, the result does not include any purchase for Audio products, but it shows the sales amount of Audio products.
Obtaining the same result with SUMMARIZE is much harder because SUMMARIZE requires specifying the source table. In this example, SUMMARIZE would produce the same result if we provided Sales as the table argument. However, it would not show any sales for Audio products if we provided Purchases as a table argument:
EVALUATE
ADDCOLUMNS (
    SUMMARIZE ( Purchases, Product[Category], Store[Country] ),
    "Sales", [Sales Amount],
    "Purchases", [Purchase Amount]
)
ORDER BY
    Product[Category],
    Store[Country]
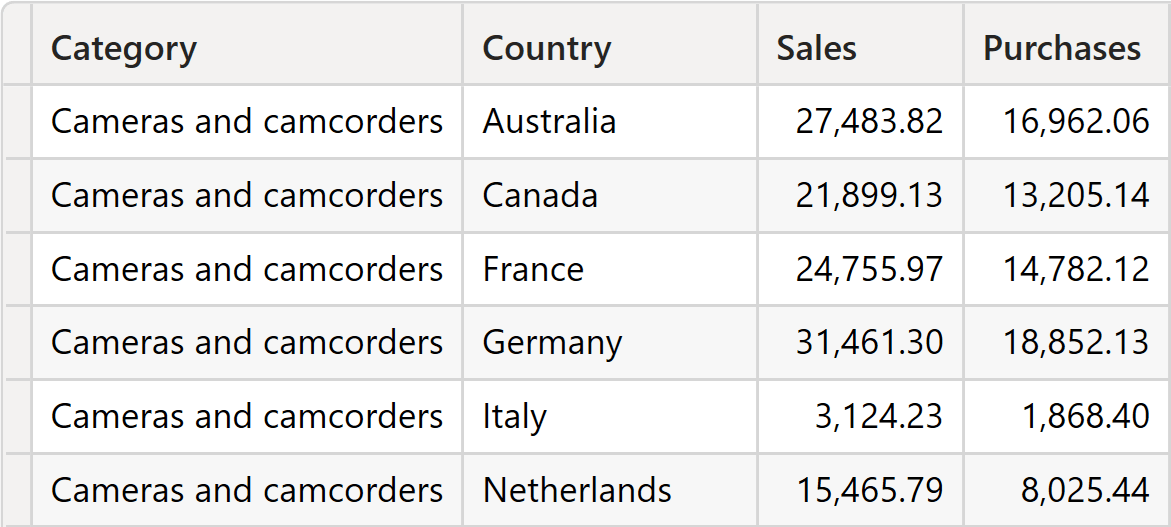
The result shows products of Cameras and camcorders in the first rows, and no Audio products are present.
In this demo example, it would be enough to start the grouping from Sales; indeed, Sales includes all the products. However, in a real-world scenario, the data distribution could be different, and there is no way to determine the right starting point for the grouping. Therefore, the only safe option would be to group both tables separately, detect the group-by tuples, and then join the partial results later:
EVALUATE
VAR P =
    ADDCOLUMNS (
        SUMMARIZE ( Purchases, Product[Category], Store[Country] ),
        "Purchases", [Purchase Amount]
    )
VAR S =
    ADDCOLUMNS (
        SUMMARIZE ( Sales, Product[Category], Store[Country] ),
        "Sales", [Sales Amount]
    )
VAR Ax =
    DISTINCT (
        UNION (
            SELECTCOLUMNS ( P, Product[Category], Store[Country] ),
            SELECTCOLUMNS ( S, Product[Category], Store[Country] )
        )
    )
VAR Result =
    NATURALLEFTOUTERJOIN ( NATURALLEFTOUTERJOIN ( Ax, S ), P )
RETURN
    Result
ORDER BY
    Product[Category],
    Store[Country]
Even though it works, this code is much more complicated than the SUMMARIZECOLUMNS version. Hence, it is slower and more error-prone. Another possible, more straightforward solution, albeit with poorer performance, is to use ADDCOLUMNS and manually perform the cross-join of the group-by columns:
EVALUATE
FILTER (
    ADDCOLUMNS (
        CROSSJOIN ( VALUES ( Product[Category] ), VALUES ( Store[Country] ) ),
        "Sales", [Sales Amount],
        "Purchases", [Purchase Amount]
    ),
    NOT ( ISBLANK ( [Purchases] ) && ISBLANK ( [Sales] ) )
)
ORDER BY
    Product[Category],
    Store[Country]
Both of these techniques work fine. Performance needs to be evaluated in your specific scenario. Using SUMMARIZECOLUMNS requires a deeper understanding of many more details. However, the semantics are relatively simple if you use only the grouping features and avoid filter arguments in SUMMARIZECOLUMNS.
Grouping and filtering
Using filters in SUMMARIZECOLUMNS is dangerous, and we suggest you avoid them. Filters in SUMMARIZECOLUMNS have very complex semantics, and they interact with the group-by columns, which creates issues with coalesced filters.
If you need to apply filters in SUMMARIZECOLUMNS, your best option is to include SUMMARIZECOLUMNS inside an outer CALCULATETABLE:
--
--  Do NOT use this pattern, which places a filter inside SUMMARIZECOLUMNS
--
EVALUATE
SUMMARIZECOLUMNS (
    Product[Brand],
    Customer[Continent],
    TREATAS ( { "Red", "Blue" }, Product[Color] ),
    "Sales", [Sales Amount]
)

--
--  Use this pattern instead, with the filter created by CALCULATETABLE
--
EVALUATE
CALCULATETABLE (
    SUMMARIZECOLUMNS (
        Product[Brand],
        Customer[Continent],
        "Sales", [Sales Amount]
    ),
    TREATAS ( { "Red", "Blue" }, Product[Color] )
)
Not only does CALCULATETABLE place the filters outside of SUMMARIZECOLUMNS, thus ensuring that no interaction occurs between internal filters of SUMMARIZECOLUMNS and group-by columns; it also performs the context transition, ensuring that no row context is active while SUMMARIZECOLUMNS is being executed. This simple way of writing DAX code makes the formula much easier to understand and much less error-prone.
If you are interested in learning more about the interactions between external and internal filters, group-by columns, value filters, and the rationale behind this best practice, you will find all the relevant information in the Understanding SUMMARIZECOLUMNS whitepaper for SQLBI+ subscribers.
Conclusions
Based on this set of best practices, it looks like Power BI does not follow them. This is not true. Power BI queries require all the features of SUMMARIZECOLUMNS; the need for subtotals, NONVISUAL filters, and complex interactions requires Power BI to use SUMMARIZECOLUMNS, because the corresponding query with SUMMARIZE would be too complex or just impossible to author. Besides, Power BI developers at Microsoft have a very profound knowledge about SUMMARIZECOLUMNS: it is very likely that because they are experts, they use all the features wisely and understand the implications of each choice. Regular DAX developers are more likely to obtain incorrect results, just because they might forget some more subtle details.
Many years ago, we asked our readers to stop using SUMMARIZE to compute new columns and to revert to the ADDCOLUMNS / SUMMARIZE pair instead, because the complexity of clustering makes SUMMARIZE too hard to use to compute columns. Here, the scenario is similar.
SUMMARIZECOLUMNS is a powerful function packed with numerous functionalities. It performs most of its operations automatically, and in most scenarios, it produces the expected result. However, when the scenario is no longer trivial, the complexity of its behavior can produce unexpected results, mostly indistinguishable from a bug.
In DAX, there is no need to create more complex code than strictly needed. Following the best practices described in this article ensures that you can leverage SUMMARIZECOLUMNS in your measures without increasing their complexity, while enjoying the best performance provided by this function.
Create a summary table for the requested totals over set of groups.
SUMMARIZECOLUMNS ( [<GroupBy_ColumnName> [, [<FilterTable>] [, [<Name>] [, [<Expression>] [, <GroupBy_ColumnName> [, [<FilterTable>] [, [<Name>] [, [<Expression>] [, … ] ] ] ] ] ] ] ] ] )
Creates a summary of the input table grouped by the specified columns.
SUMMARIZE ( <Table> [, <GroupBy_ColumnName> [, [<Name>] [, [<Expression>] [, <GroupBy_ColumnName> [, [<Name>] [, [<Expression>] [, … ] ] ] ] ] ] ] )
Creates a summary the input table grouped by the specified columns.
GROUPBY ( <Table> [, <GroupBy_ColumnName> [, [<Name>] [, [<Expression>] [, <GroupBy_ColumnName> [, [<Name>] [, [<Expression>] [, … ] ] ] ] ] ] ] )
Returns a table with new columns specified by the DAX expressions.
ADDCOLUMNS ( <Table>, <Name>, <Expression> [, <Name>, <Expression> [, … ] ] )
Tags a measure expression specified in the call to SUMMARIZECOLUMNS function to be ignored when determining the non-blank rows.
IGNORE ( <Measure_Expression> )
Mark the filter as NonVisual.
NONVISUAL ( <Expression> )
When a column name is given, returns a single-column table of unique values. When a table name is given, returns a table with the same columns and all the rows of the table (including duplicates) with the additional blank row caused by an invalid relationship if present.
VALUES ( <TableNameOrColumnName> )
Evaluates a table expression in a context modified by filters.
CALCULATETABLE ( <Table> [, <Filter> [, <Filter> [, … ] ] ] )