 Marco Russo & Alberto Ferrari
The end result in this scenario is a report where the user has selected a date with a slicer, and a chart shows the values of a measure in the months prior to that date. The following screenshot shows the expected result.
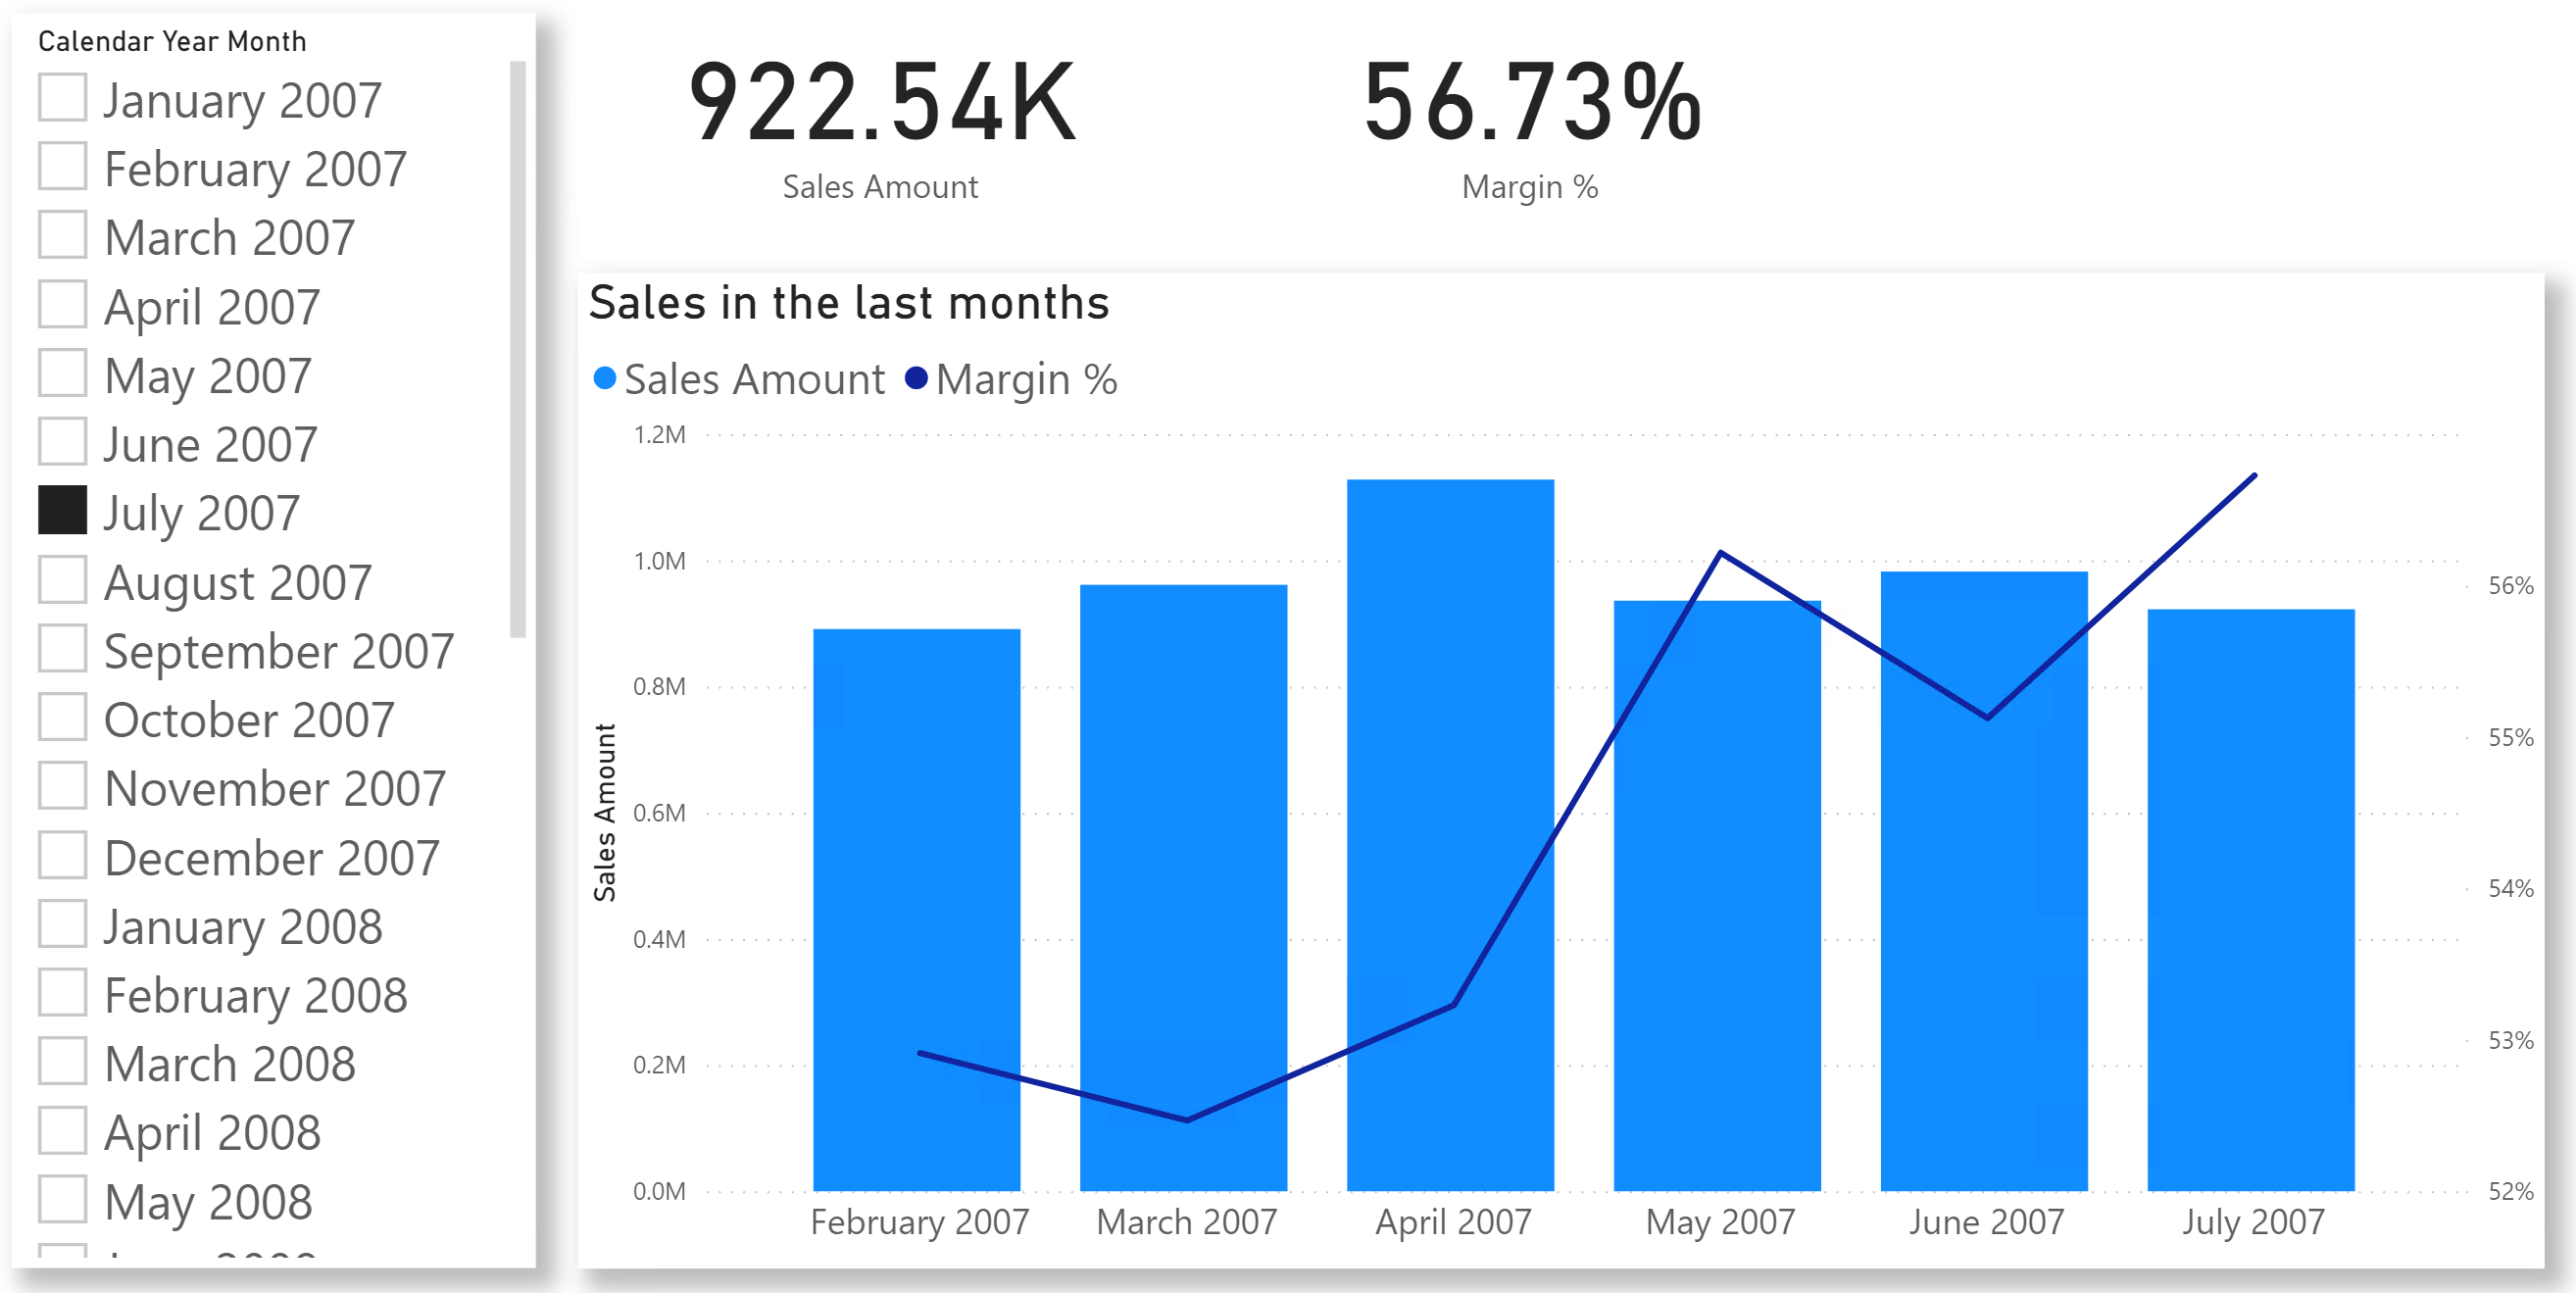
There are a couple of important details to note in the example:
- The selection in the slicer is on a single month. Therefore, all visuals show the data for that date only. All except for the chart. Indeed, we want the chart to show additional months – the previous six in the example.
- The chart is showing both the sales amount and the margin percentage. We want the chart to work with any measure and always show its behavior in the previous six months.
Because the axis of the visual must show months outside of the slicer selection, we cannot use the usual Date[Calendar Year Month] column. Indeed, if we put the Date[Calendar Year Month] column on the X-axis, the only visible month would be the selected month. It is worth remembering that the selection of the values to show on the axis is independent from the measure. If a slicer is filtering one month, there is no way to show additional months from the same table on either the rows or the columns (or the X-axis, as in the example).
Therefore, we must create a separate table that is not subject to filtering from the slicer. This way, columns from that table show all the rows, and we can control their visibility through a measure. Once the new table is in place, we write a measure that produces a value for only the last six months out of all the months visible, and leaves the remaining months blank in order to hide them.
The new table is named Previous Date, and it is just a copy of the Date table:
Previous Date = 'Date'
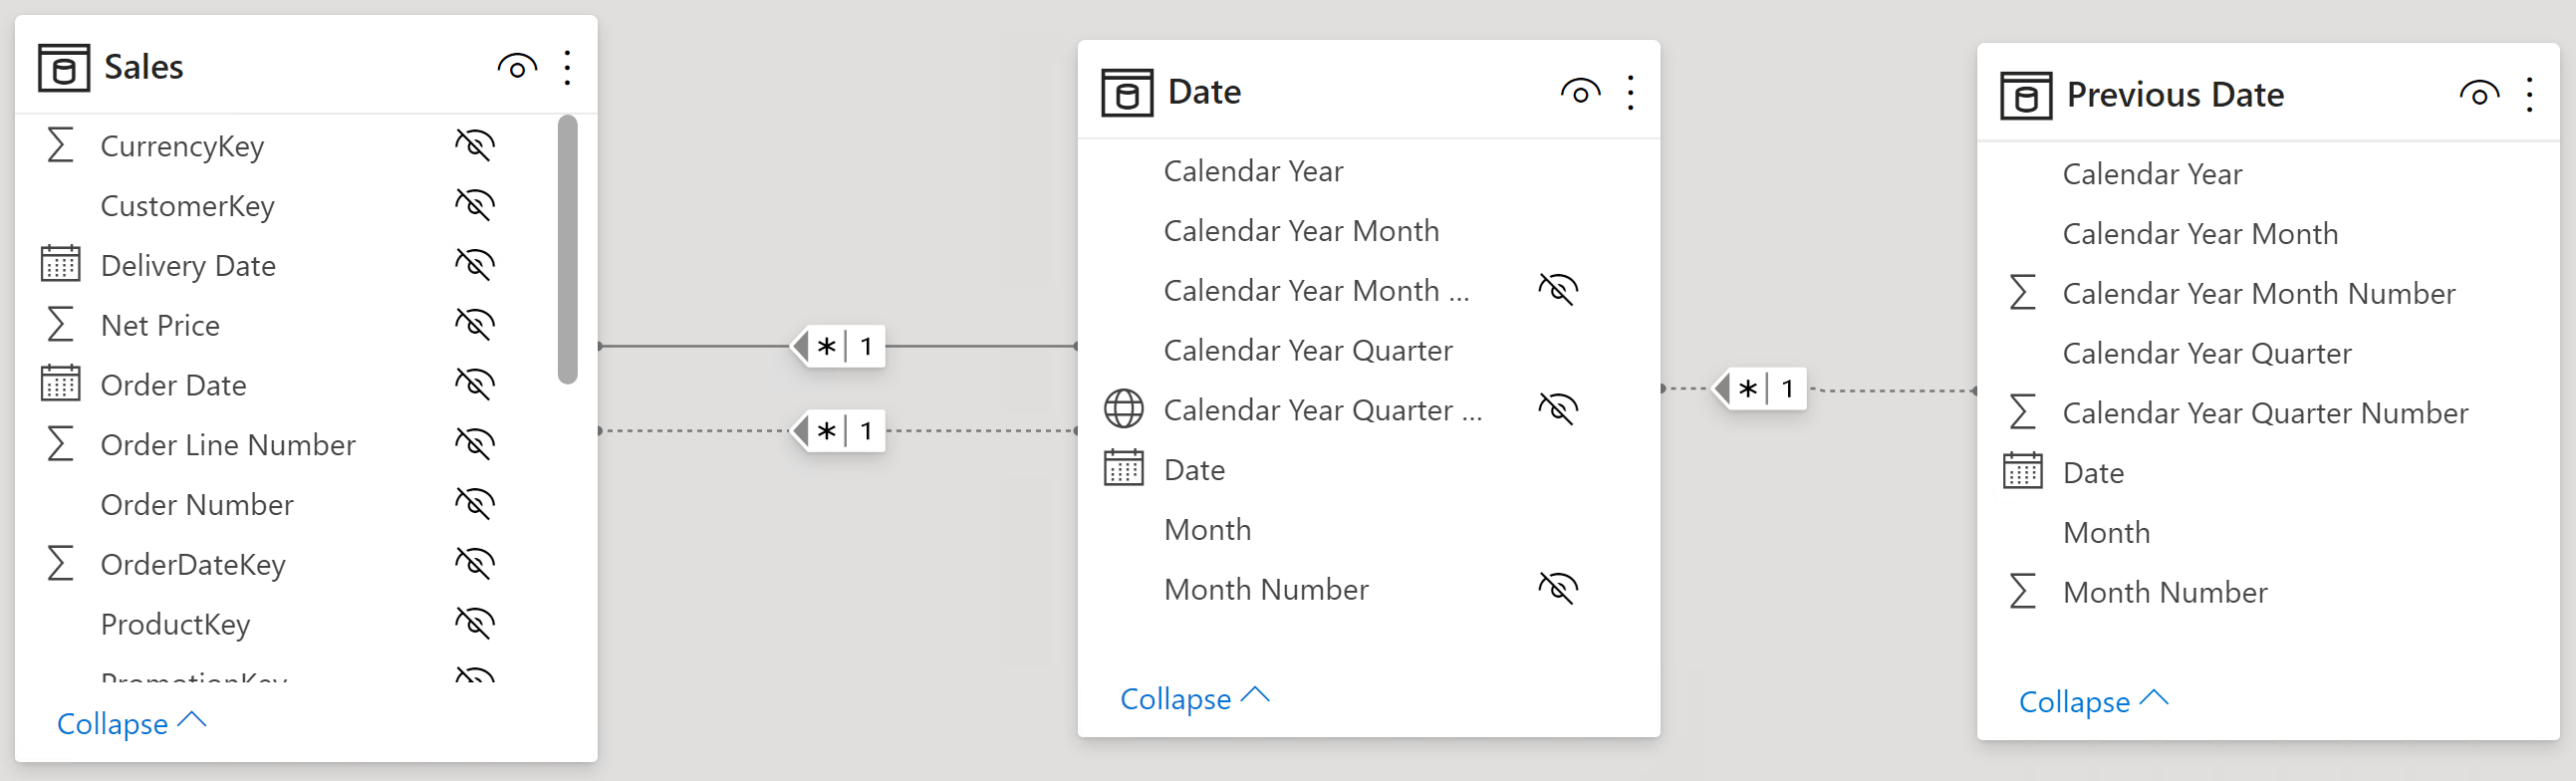
The next step is to link the table to the remaining part of the model. Even though we could link Previous Date with Sales directly, it is better to create a relationship between Date and Previous Date. We keep the relationship inactive to control if and when the relationship is enabled. The resulting model is the following.
The last step is to author DAX code to:
- Retrieve the selected date from the Date We use as a reference date the last date visible in the Date table, and we show the previous six months;
- Create a filter with the previous six months and apply it to the Previous Date table;
- Activate the relationship between Previous Date and Date, so that the newly computed filter operates on Date.
As part of the code, we also should pay attention to a couple of details:
- The new filter (with 6 months) must replace the active filter on Date. Therefore, we should remove any filter on Date;
- The new filter always contains six months. We need to intersect the new filter with the filter coming from the visual, which contains a single month.
We implemented this logic in a calculation group named Previous Period with a calculation item that filters the last 6 months:
--
--  This calculation item works together with the Previous Date table to show
--  6 months back from the currently selected date in the Date table.
--
'Previous Period'[Previous Period]."Previous 6 Months" =

VAR NumOfMonths = -6
VAR ReferenceDate = MAX ( 'Date'[Date] )
VAR PreviousDates =
    DATESINPERIOD (
        'Previous Date'[Date],
        ReferenceDate,
        NumOfMonths,
        MONTH
    )
VAR Result =
    CALCULATE (
        SELECTEDMEASURE (),
        REMOVEFILTERS ( 'Date' ),
        KEEPFILTERS ( PreviousDates ),
        USERELATIONSHIP ( 'Previous Date'[Date], 'Date'[Date] )
    )
RETURN Result
In order to activate the calculation item in a visual, you should add a constraint that filters the required calculation item in the filters of that visual. The calculation item creates a filter that is a list of dates, which we refer to as a set. That set is stored in the PreviousDates variable. The filter context where the measure is being evaluated ends up including only the dates specified in PreviousDates. The presence of KEEPFILTERS guarantees that the filter stored in PreviousDates does not override the original filter context.
The result is the same as the first figure of the article.
If the business requirement is to always show a fixed number of months, then the code as it is now is what you want. If you need to let the user decide how many months to show, then you need a parameter table; you must intercept the user’s selection and replace the NumOfMonths variable with the result of SELECTEDVALUE to retrieve the required number of months.
This solution is very simple and efficient. It only requires a few lines of DAX code that operate on small tables. Therefore, we expect performance to be quite optimal.
Changes the CALCULATE and CALCULATETABLE function filtering semantics.
KEEPFILTERS ( <Expression> )
Returns the value when there’s only one value in the specified column, otherwise returns the alternate result.
SELECTEDVALUE ( <ColumnName> [, <AlternateResult>] )