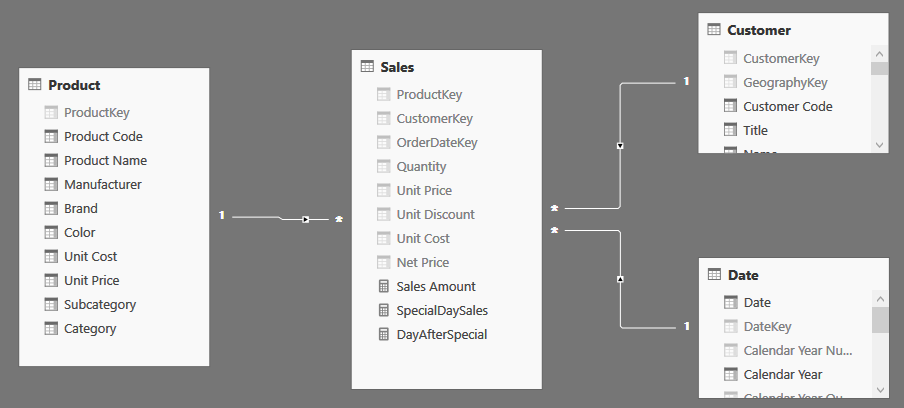
In Power BI Desktop and SQL Server Analysis Services 2016 the SELECTCOLUMNS function allows you to retrieve some of the columns out of a table. This enables you to write set operations and queries in a very simple way. But, as it often happens with powerful functionalities, it hides some complexity, and this puzzle is aimed to test your understanding of SELECTCOLUMNS.
Scenario
You have a canonical star schema.
In the Date table there is a column indicating whether a day is a special offer day or not. In addition, you know that Saturday, in your specific business, are always to be considered special days. Therefore, you create a measure to compute sales in special days:
SpecialDaySales :=
VAR SpecialDates =
    UNION (
        SELECTCOLUMNS (
            FILTER ( 'Date', 'Date'[SpecialDay] = "Special Offer Day" ),
            "Date", [Date]
        ),
        SELECTCOLUMNS (
            FILTER ( 'Date', 'Date'[Day Of Week] = "Saturday" ),
            "Date", [Date]
        )
    )
RETURN
    CALCULATE ( [Sales Amount], SpecialDates )
This measure works just fine; the challenge is coming in the next step.
The Challenge
You are worried that sales, in the day after a special one, are lower than the average. To double-check it, you create a new measure that computes the sales in the day after a special one. You know that you need a special day and add 1, or any Sunday. Thus, your code looks like this:
AfterSpecialDaySales :=
VAR AfterSpecialDates =
    UNION (
        SELECTCOLUMNS (
            FILTER ( 'Date', 'Date'[SpecialDay] = "Special Offer Day" ),
            "Date", [Date] + 1
        ),
        SELECTCOLUMNS (
            FILTER ( 'Date', 'Date'[Day Of Week] = "Sunday" ),
            "Date", [Date]
        )
    )
RETURN
    CALCULATE ( [Sales Amount], AfterSpecialDates )
Unfortunately, this measure returns wrong results. As you can see in the next figure, it always reports the total sales, which is clearly wrong:
Can you explain what is happening and, optionally, correct the measure?
Hints
The correct result for AfterSpecialDaySales measure is illustrated in the following figure:

Solution
To see the solution, just press the button below.

