 Marco Russo & Alberto Ferrari
The primary reason to adopt the new calendar-based time intelligence in Power BI is its flexibility (read more on Introducing calendar-based time intelligence in DAX). Classic time intelligence functions work out of the box and deliver meaningful results in most scenarios. However, to do so, they make assumptions about the calendar structure and the desired outcomes. Sometimes, the choices are not aligned with the user requirements, and developers need to author their own time intelligence calculations.
The new calendar-based time intelligence functions provide greater flexibility by allowing developers to configure parameters that drive the internal algorithms to meet diverse requirements. Using these parameters requires a precise understanding of the scenario for which they were built, which requires some attention to detail.
Most of the article focuses on understanding the complex scenarios you may encounter when performing time-intelligence calculations. Choosing the right set of arguments is a very simple step if you understand the scenario well, but it may be a frustrating experience if you just try these arguments without having already gained the required knowledge. In this article, we focus on a specific function: DATEADD, which shifts time intervals. Be mindful that DATEADD is internally used by many time intelligence calculations; therefore, the concepts explained for DATEADD apply to other time intelligence functions, like, for example, DATESINPERIOD.
Comparing months with different lengths
DATEADD shifts the original selection (the current filter context) back and forth by the specified number of intervals, where an interval can be DAY, WEEK, MONTH, QUARTER, or YEAR. For example: DATEADD ( ‘Gregorian’, -6, MONTH ) shifts the current filter context six months back in time. The interval is MONTH, -6 is the number of months to shift, Gregorian is the calendar to use.
Let us start investigating the scenario with a simple measure that computes the sales in the previous month, using classic time intelligence:
Sales PM Date =
CALCULATE (
    [Sales Amount],
    DATEADD ( 'Date'[Date], -1, MONTH )
)
Using the measure in a report shows that the sales of January 2024 are reported correctly in February 2024.
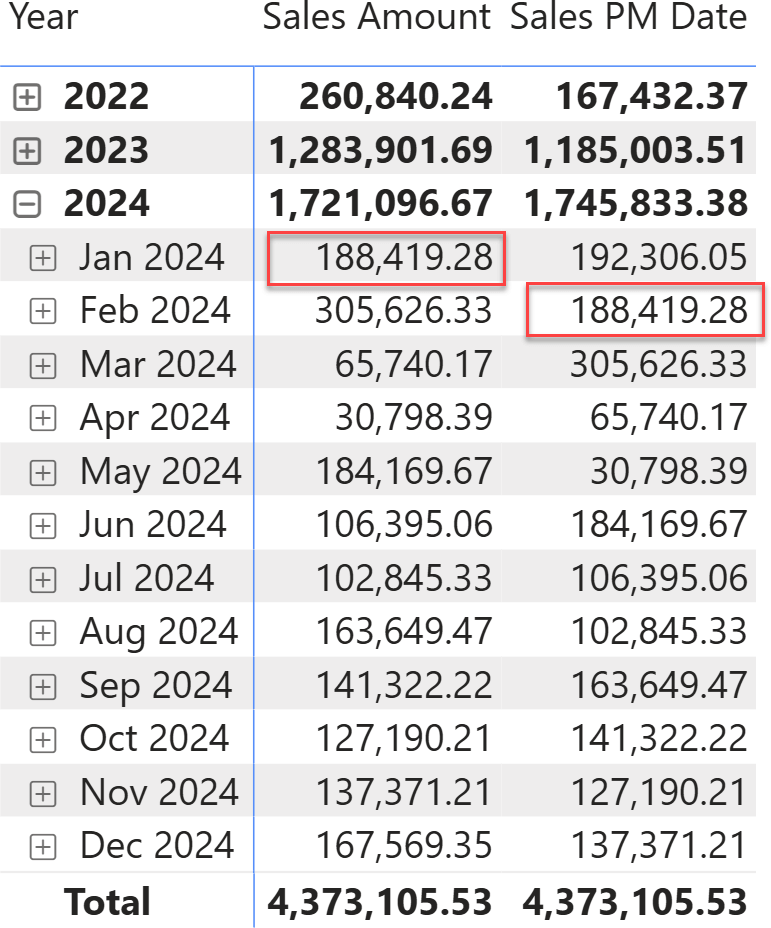
Despite it looking natural and correct, the result requires a deeper understanding. February 2024 contains 29 days, because 2024 is a leap year. January 2024 contains 31 days. The report is currently comparing two periods of different lengths. We are so used to variable-length months that we seldom worry about the fact that the we compare entities that are different (in this case in number of days). For the purposes of this article, the key point is that the two months have different lengths.
The same scenario happens when comparing March 2024 with February 2024 or – in general – whenever we compare two months with a different number of days.
It is important to note that right now, the granularity of the values we are inspecting is the month, and the period used for the shift is also the month. When the granularity of the selection and the granularity of the period used for the shift are the same, numbers are easy to read.
If we expand the matrix at the day level, the selection granularity becomes the day, while the period-to-shift granularity is the month. The measure still reports correct results: each day in February is shifted back to the same day in January. As expected, Sales PM Date on the third of February reports the sales of the third of January.
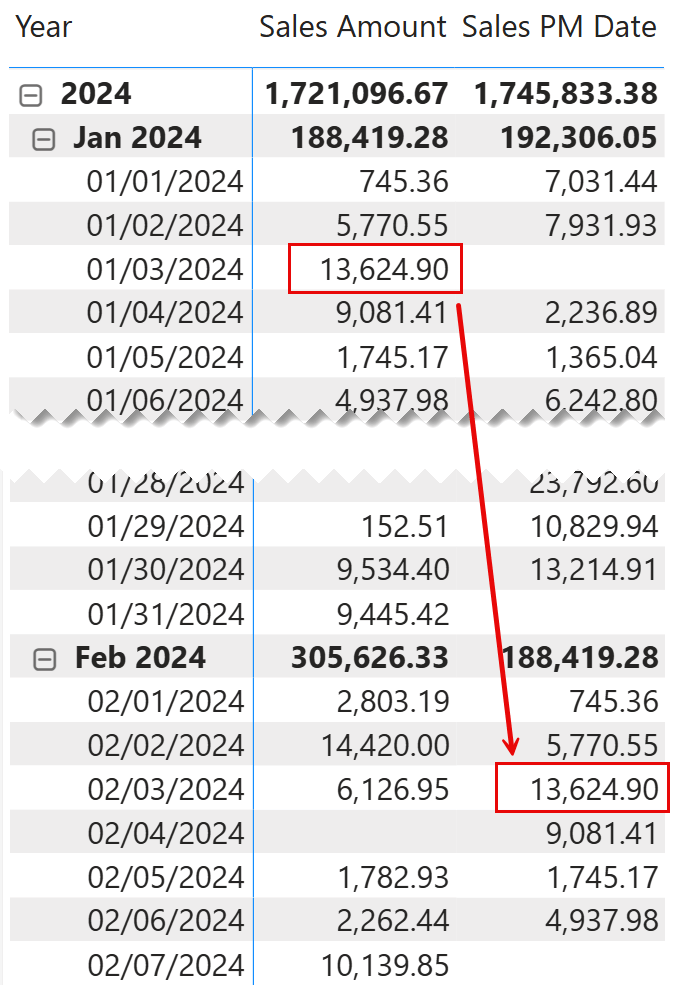
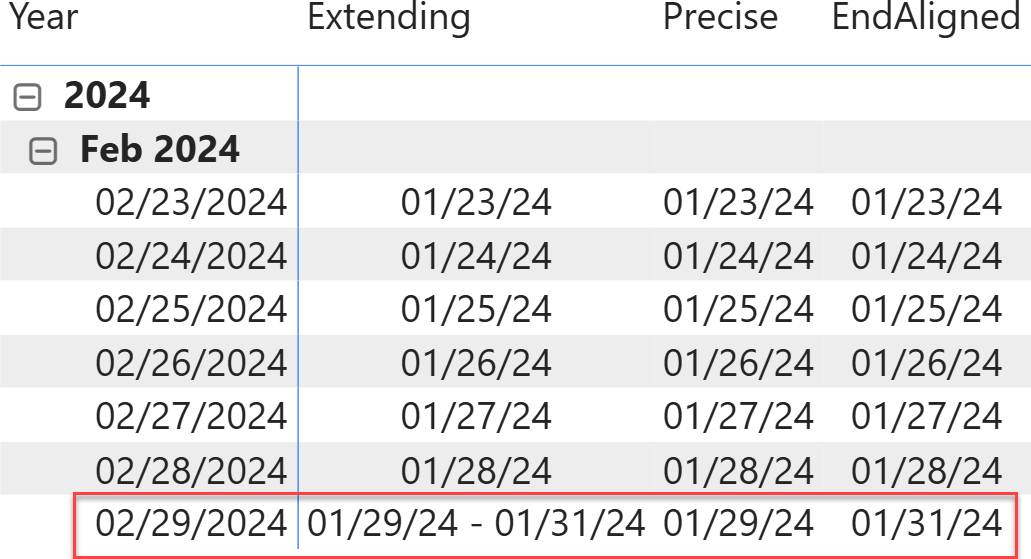
The scenario quickly becomes more complex i\f, rather than looking at the beginning of the month, we go to the end of February, namely the 29th of February.
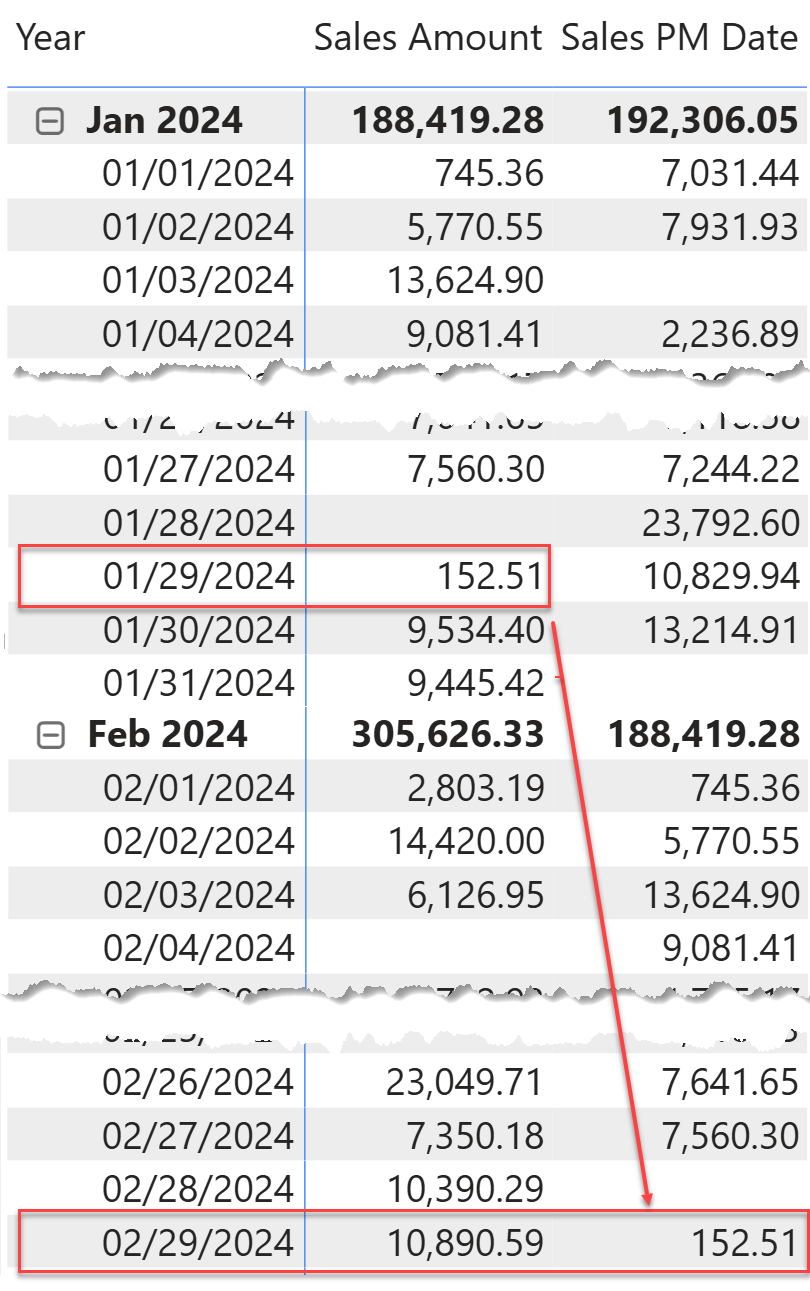
The 29th of February correctly shows the value of sales for the 29th of January. However, January includes two additional days with sales: the 30th and 31st, which are not shown in February.
Let us repeat this simple concept: January 2024 has 31 days, with a total Sales Amount of 188,419.28. February 2024 contains only 29 days; Sales PM Date displays the exact sales amount of the corresponding day in the previous month. Two dates and their corresponding sales (9,534.40 and 9,445.42 for the 30th and 31st of January) are missing. Still, the total is the same: 188,419.28. In other words, the total shown is not the sum of the displayed daily rows.
Be mindful: this is not an incorrect behavior. It is a precise choice made by DAX to solve a problem that has no clear and simple solution: comparing two months with a different number of days, and showing the daily values at the same time, requires a compromise because we need to pack the total of $188,419.28 into only 29 rows rather than the original 31.
The problem is not new; it has always been there. Classic time intelligence functions addressed this scenario differently. The same formula to compute the sales in the previous month can be written using the new calendar-based time intelligence:
Sales PM Cal =
CALCULATE (
    [Sales Amount],
    DATEADD ( 'Gregorian', -1, MONTH )
)
Quite surprisingly, the result is different.
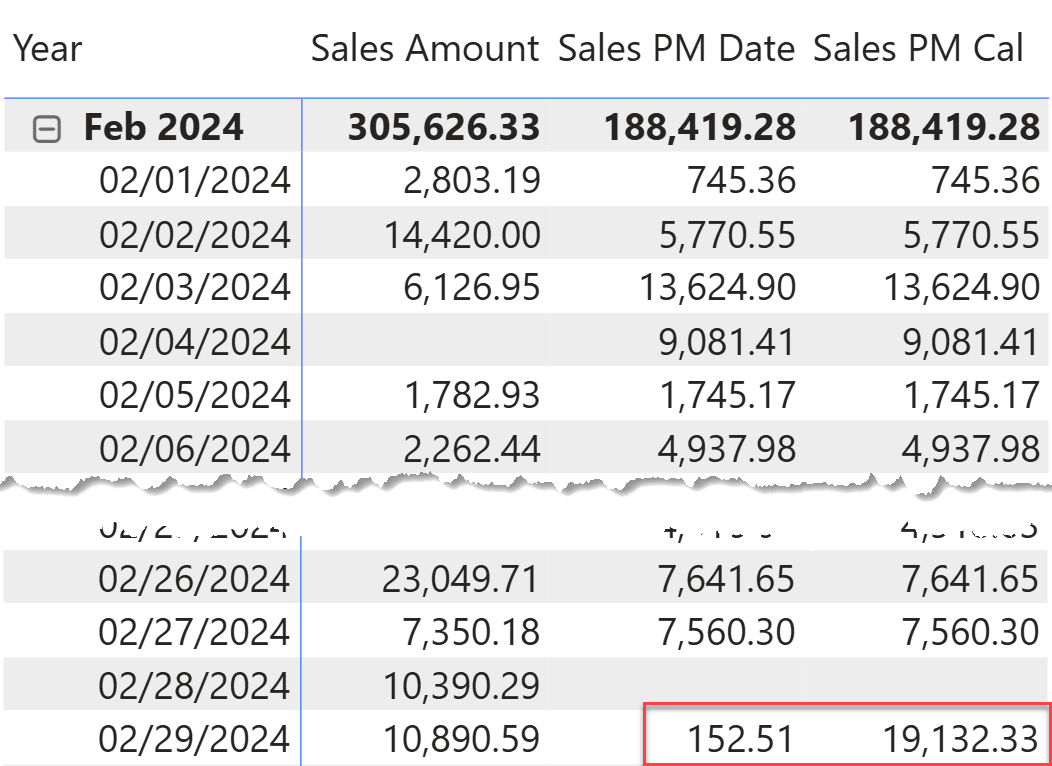
As you can see, on the 29th of February, the calendar-based time intelligence calculation returns 19,132.33 rather than 152.51. The difference between these two amounts is the exact sum of the two additional days that exist in January and that do not exist in February. In other words, the selection of one day in February (Feb 29th) is transformed into the selection of three days in January (Jan 29th, 30th and 31st).
This behavior is neither better nor worse: it is a different choice, and it is just a default choice that can be modified with additional parameters. The advantage is that the rows sum to the month total; the disadvantage is that day-level comparisons are inaccurate because we are comparing one day against three. As we anticipated, solving the problem requires a compromise, and the calendar-based time intelligence chose a different solution compared to the classic time intelligence.
This is a key difference between calendar-based time intelligence and classic time intelligence: in classic time intelligence, the DAX engine defines the behavior, and there is no way to change it. In calendar-based time intelligence, a set of additional parameters allows developers to specify how to handle time periods of varying lengths.
Understanding Extension and Truncation
Now that we have a clearer picture of the scenario, it is time to be more precise and define the rules of the game. DATEADD shifts the original selection (the current filter context) back and forth by the specified number of intervals, where an interval can be DAY, WEEK, MONTH, QUARTER, or YEAR.
In our example, we shifted Feb 29th one month back; the original selection is Feb 29th, the interval is MONTH, and the shift is -1.
When the original selection is at a finer grain than the interval, as in the examples we have shown so far, DATEADD uses the same-distance-from-parent technique. Because Feb 29th is the 29th day in February, it is shifted to the 29th day in January, which (surprise, surprise!) is the 29th of January. This algorithm works fine as long as the periods have the same length. If the periods have different lengths (like months in a Gregorian calendar), there are two possible scenarios, depending on which period is longer.
- Extension: The resulting period is larger than the original period. For example, shifting the 29th of February one month back may return only one day (the 29th of January) or multiple days (from the 29th to the 31st of January), depending on the current end date of the selection. In other rows, the current selection may be extended to a larger selection.
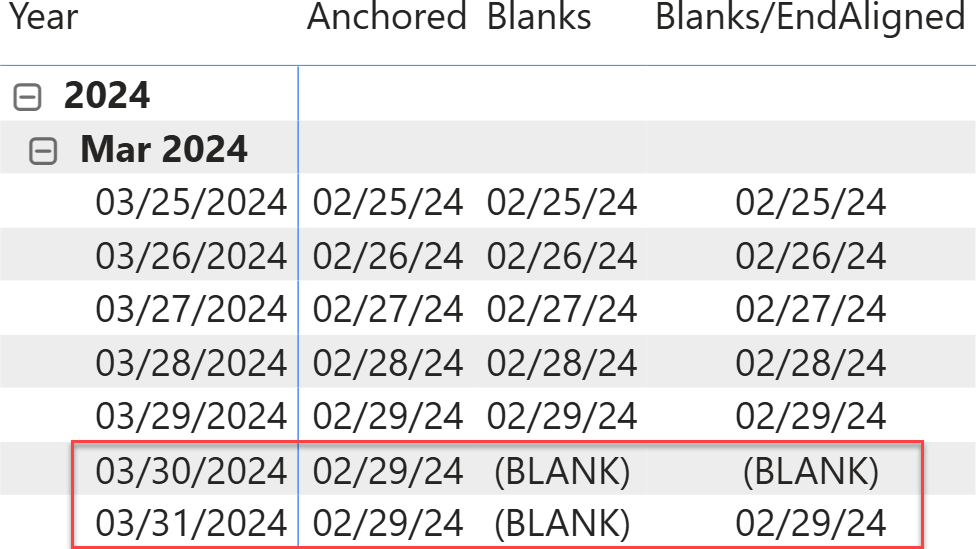
- Truncation: The resulting period is shorter than the original period. For example, shifting the 30th of March back one month makes it impossible to find the 30th day of February. In this case, it is possible to produce either a blank (there is no 30th of February) or to return the last day of February, anchoring the result to the end of the period.
Extension and Truncation are indeed the two additional parameters of DATEADD to handle these two scenarios.
Extension is effective when comparing the current period with a larger one; it changes only how the last day of the current period is shifted. Extension can be one of three values:
- EXTENDING: this is the default behavior. If the current selection contains the last day of the interval (as is the case for the 29th of February), DATEADD returns all the dates from the 29th of January up to the end of January. In this case, a single date is transformed into a selection of multiple dates.
- PRECISE: The 29th of February is shifted back to the 29th of January. The 30th and 31st of January are not shown in the report, because there is neither a 30th nor a 31st of February. This is the same behavior as the classic time intelligence.
- ENDALIGNED: the 29th of February is shifted back to the 31st of January (end of periods are aligned). In this scenario, neither the 29th nor the 30th of January are shown. ENDALIGNED can be useful in some fancy scenarios, as we are about to show later.
In the following report you can see the dates returned by DATEADD. You can see that the 29th of February is shifted back to three different periods, depending on the value used for the Extension argument.
Truncation is effective when the current period is larger than the resulting period, for example, when moving back one month from March to February. Truncation changes how the last days of the current period (those that do not exist in the previous month) are shifted. Truncation can be:
- ANCHORED: the 29th, 30th, and 31st of March are shifted back to the 29th of February. In other words, all the dates from the current month, that do not exist in the previous month are routed to the last date of the previous month, possibly repeating the same value multiple times.
- BLANKS: the 30th and 31st of March result in BLANK, because there is no corresponding date in the previous month. One important note: if EndAligned is specified for Extension, it also applies to Truncation, thus moving the last day to the last day of the previous period.
In the following diagram, you can see the effect of different Truncation and Extension values:
Choosing the correct set of values for Extension and Truncation is up to the developer. There is no “correct” solution: each has its own advantages and disadvantages that
need to be discussed with users to produce useful, easily-understandable reports.
A more practical scenario
We want to compute a moving average over the last six months. We create two versions of the same calculation: one using classic time intelligence and one using calendar-based time intelligence. The two versions yield different results; we need to understand the problem and identify the correct parameter to use. As is often the case, understanding the issue is much harder than fixing the problem.
Here are the two measures:
Moving Average Calendar =
CALCULATE (
    DIVIDE (
        [Sales Amount],
        COUNTROWS ( SUMMARIZE ( Sales, 'Date'[Year Month Number] ) )
    ),
    DATESINPERIOD ( 'Gregorian', MAX ( 'Date'[Date] ), -6, MONTH )
)
Moving Average Classic =
CALCULATE (
    DIVIDE (
        [Sales Amount],
        COUNTROWS ( SUMMARIZE ( Sales, 'Date'[Year Month Number] ) )
    ),
    DATESINPERIOD ( 'Date'[Date], MAX ( 'Date'[Date] ), -6, MONTH )
)
As you can see, the two measures differ only in how they use DATESINPERIOD. When used in a matrix, the two measures always provide the same result, with some noticeable exceptions.
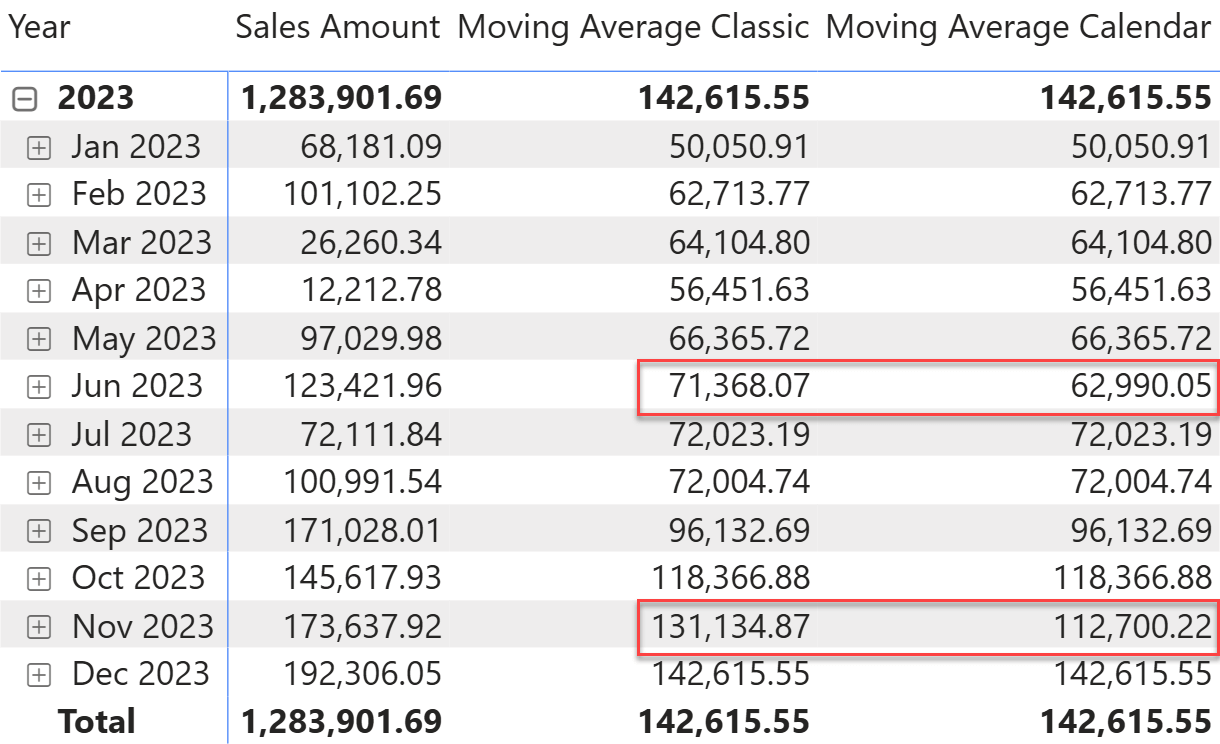
Two months in 2023 show a difference. Given the significant increase in sales in Jun 2023, the Classic version appears to produce the correct result. The Calendar version produces a smaller value, which is inconsistent with the increase in sales.
Let us elaborate on what happened in Jun 2023. DATESINPERIOD needs to shift the end of the month back by 6 months. To do so, it moves the provided date back by 6 months, then starts on the next day. The end of June 2023 is the 30th of June. Moving the 30th of June 6 months back produces the 30th of December 2023. DATESINPERIOD considers valid dates from the 31st of December (the day after the 30th) through to the 30th of June.
As you may already see, there is an error. DATESINPERIOD should start from the first of January, not from the 31st of December. However, because June has 30 days and December has 31, DATESINPERIOD (which internally uses DATEADD) returns the wrong start of the shifted period.
The error has two side effects: it adds an extra day and, worse, it counts an extra month (there are seven months from December to June, compared to the six months required by our calculation).
Recapping the considerations: when a month with 30 days is shifted back to a month with 31 days, our formula adds an extra day and month. We need to make sure that the last day of the month is moved back to the last day of the corresponding month. As it turns out, EndAligned is the algorithm to use. Indeed, DATESINPERIOD accepts the Extension parameter as an additional argument, thus allowing developers to choose between PRECISE and ENDALIGNED.
Changing the measure to the following definition using ENDALIGNED makes the measure compute the correct result:
Moving Average Calendar =
CALCULATE (
    DIVIDE (
        [Sales Amount],
        COUNTROWS ( SUMMARIZE ( Sales, 'Date'[Year Month Number] ) )
    ),
    DATESINPERIOD ( 'Gregorian', MAX ( 'Date'[Date] ), -6, MONTH, ENDALIGNED )
)
Conclusions
Classic time intelligence functions work out of the box because the complexity of the time intelligence calculations is hidden in the internal logic. Classic time intelligence relies on the assumption that the calendar under consideration is the standard Gregorian calendar.
The new calendar-based time intelligence functions do not rely on calendar knowledge; developers must tag columns and provide the required metadata for these functions to work. As a consequence, some of the automated behavior that simplifies the lives of developers had to be removed, and calendar-based time intelligence calculations may produce unexpected results if parameters are not properly aligned with the report requirements.
Your task, as a wise DAX developer, is to know the details about how these functions work and provide the correct set of arguments and/or metadata to the DAX engine to provide the correct results.
Calendar-based time intelligence gives developers greater power, which in turn requires more responsibility and control.
Moves the given set of dates by a specified interval.
DATEADD ( <Dates>, <NumberOfIntervals>, <Interval> [, <Extension>] [, <Truncation>] )
Returns the dates from the given period.
DATESINPERIOD ( <Dates>, <StartDate>, <NumberOfIntervals>, <Interval> [, <EndBehavior>] )
Returns a number from 1 to 31 representing the day of the month.
DAY ( <Date> )
Returns a number from 1 (January) to 12 (December) representing the month.
MONTH ( <Date> )
Returns a number from 1 (January-March) to 4 (October-December) representing the quarter.
QUARTER ( <Date> )
Returns the year of a date as a four digit integer.
YEAR ( <Date> )
Returns a blank.
BLANK ( )