DAX supports multiple relationships between tables, even if only one out of the many can be active at any time. USERELATIONSHIP, with CALCULATE, lets you activate one relationship, deactivating the other ones. As soon as you mix USERELATIONSHIP, CALCULATE, row context and context transition, the formulas tend to be much more complex than expected. If you feel confident with these topics, then this is the puzzle for you: a simple scenario, an innocent formula that looks easy at the beginning, but – as always – the devil is in the details.
Scenario
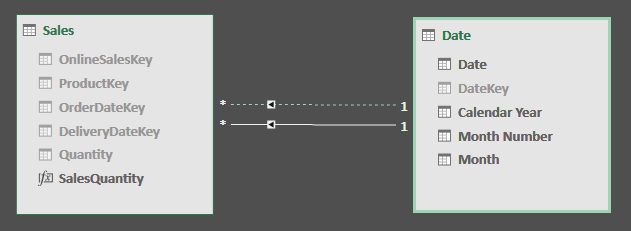
The Sales table has two relationships with Date. The first, based on OrderDateKey, is active. The second one, based on DeliveryDateKey, is inactive.
The Challenge
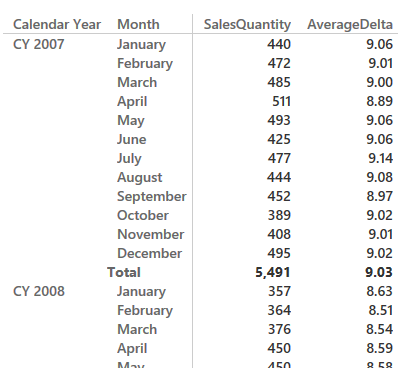
Compute the difference in days between the order date and the delivery date for each row of the Sales table, and report the average of this number for the transactions filtered in a query. In the following example you can see the expected result of this average:
Hints
You should create a single measure to obtain the result. However, you can also split the calculation in three steps:
- First, create a calculated column in Sales containing the order date.
- Second, create a calculated column in Sales containing the delivery date.
- Third, compute a third column containing the difference between the previous two.
A simple AVERAGE of the third column provides the desired result. After you check the results, you can consolidate the entire calculation in a single measure, avoiding the three calculated columns, or at least skip the third calculated columns, using AVERAGEX instead of AVERAGE.
Solution
To see the solution, just press the button below.