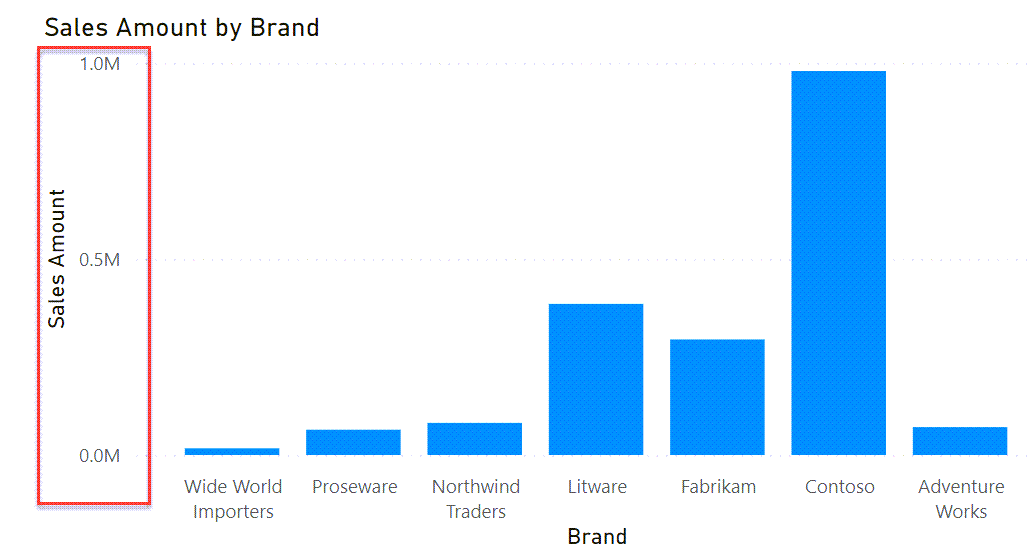
You can rely on DAX expressions to control the behavior of some aspects of Power BI visuals. This article shows a few examples of how to manage the range of charts.
Read more
|
|||||||||||||||||||||||||||||||||||||||||||||||||||||||||||||||||||||||||||||
|
You are receiving this email because you have registered to a mailing list from sqlbi.com. If you would like to avoid similar emails in the future, please change your email preferences by clicking the link above.
© 2023 SQLBI Corp. · 5348 Vegas Drive, Las Vegas, NV 89108 US · Privacy Policy
|
|||||||||||||||||||||||||||||||||||||||||||||||||||||||||||||||||||||||||||||


