Topic: Power BI
-
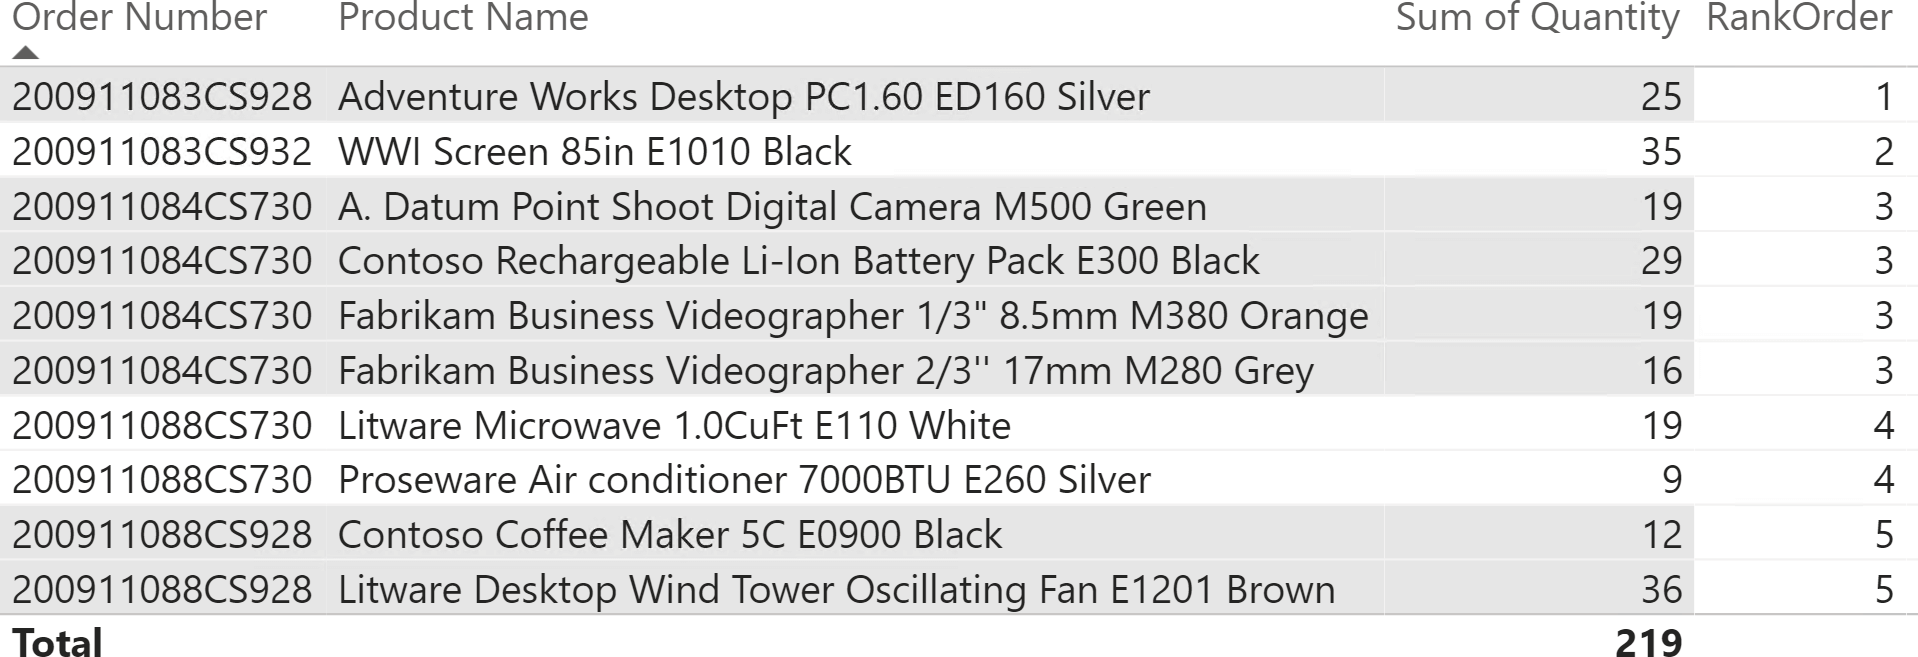
This article describes how to use conditional formatting with a DAX expression to color the rows of a table in Power BI based on the order number instead of using the alternate rows color formatting option. Read more
-
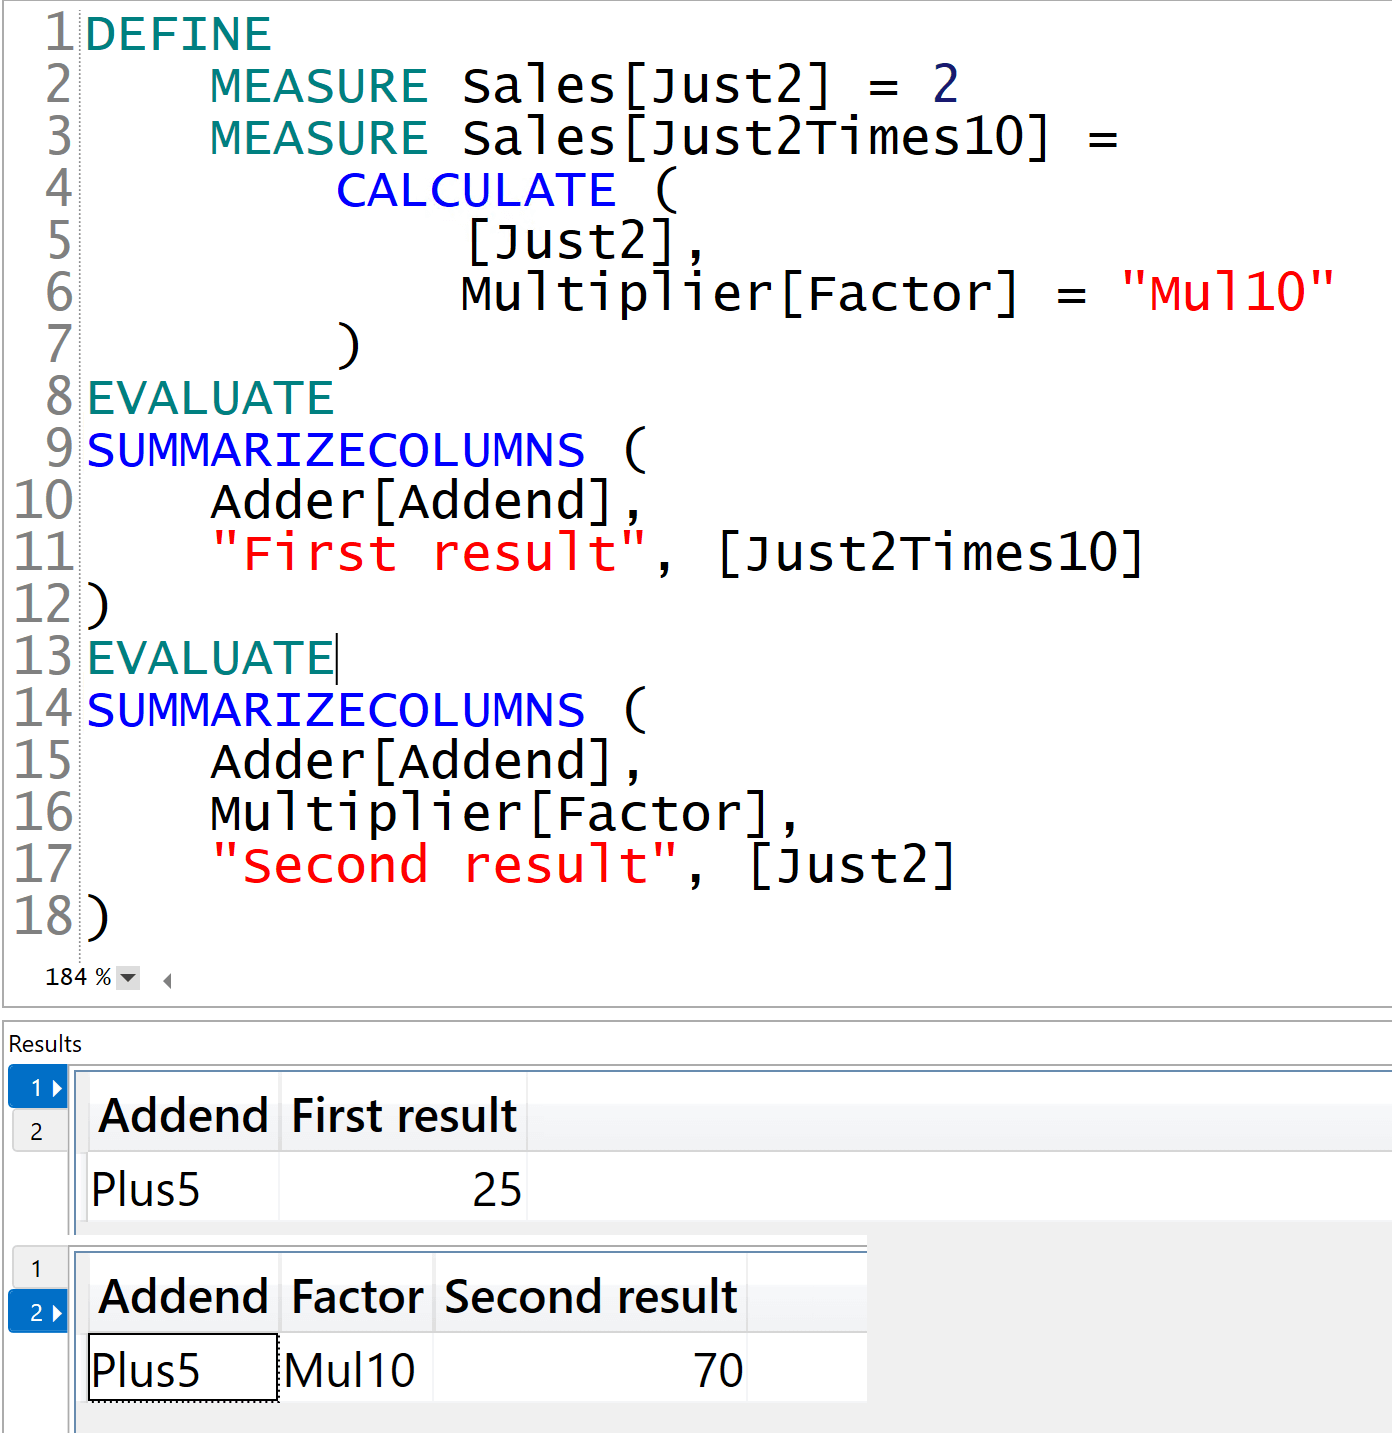
This article describes in which conditions the precedence of calculation groups might return unexpected results when filtering calculation items in both the visuals and the measures present in a report. Read more
-
This article explains how to control the result provided by a formula in a DAX measure when the meas-ure is being used in a report with granularity below the granularity supported by the formula. Read more
-
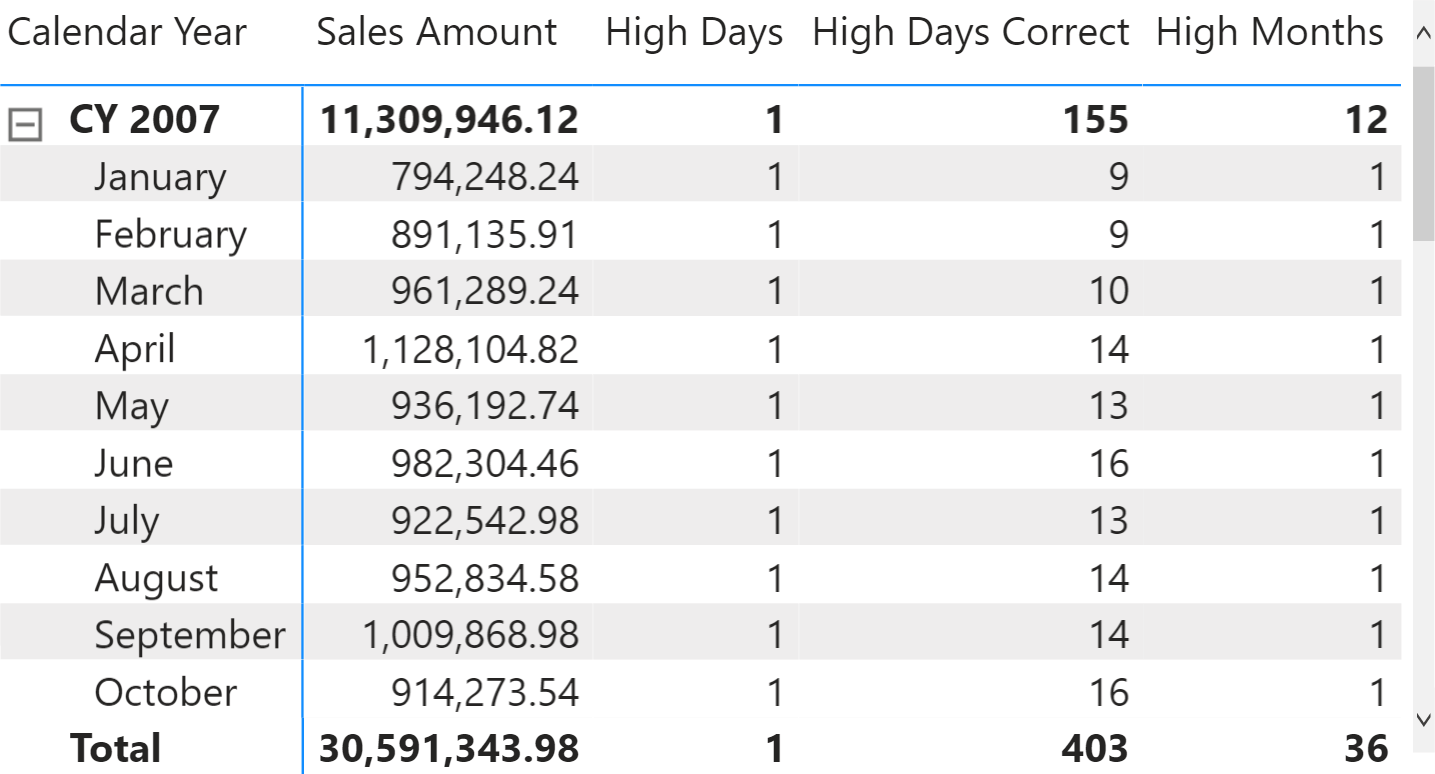
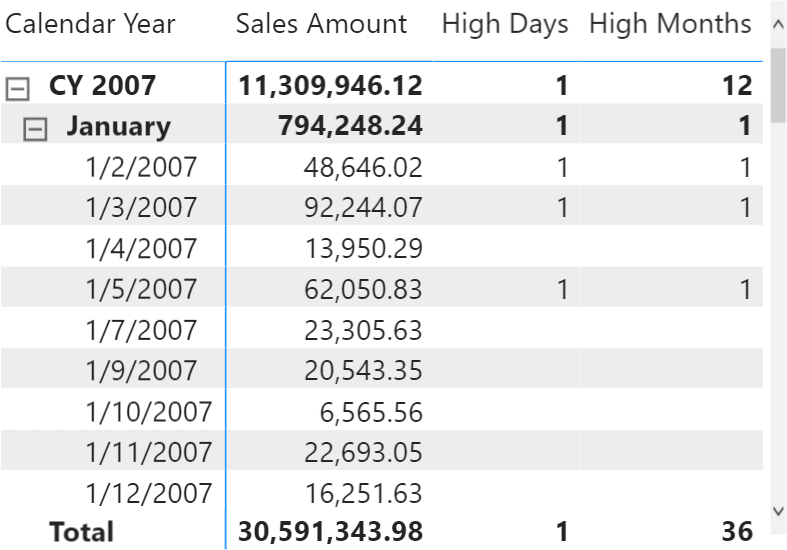
This article describes how to compute visual totals accurately, in case a measure does not provide the right result at the total level but works correctly in other rows of the report. Read more
-
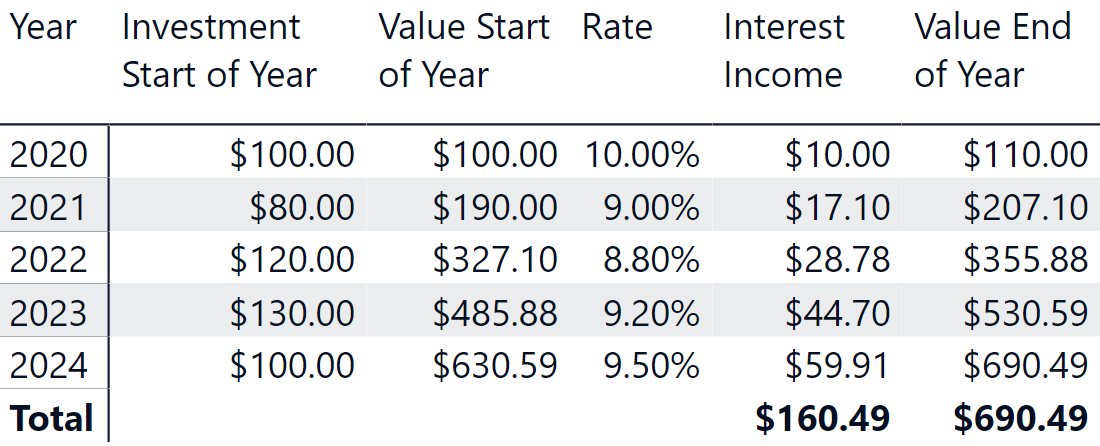
This article describes how to write efficient DAX expressions that compute the compound interest of incremental investments made throughout the holding period, using the PRODUCTX function. Read more
-
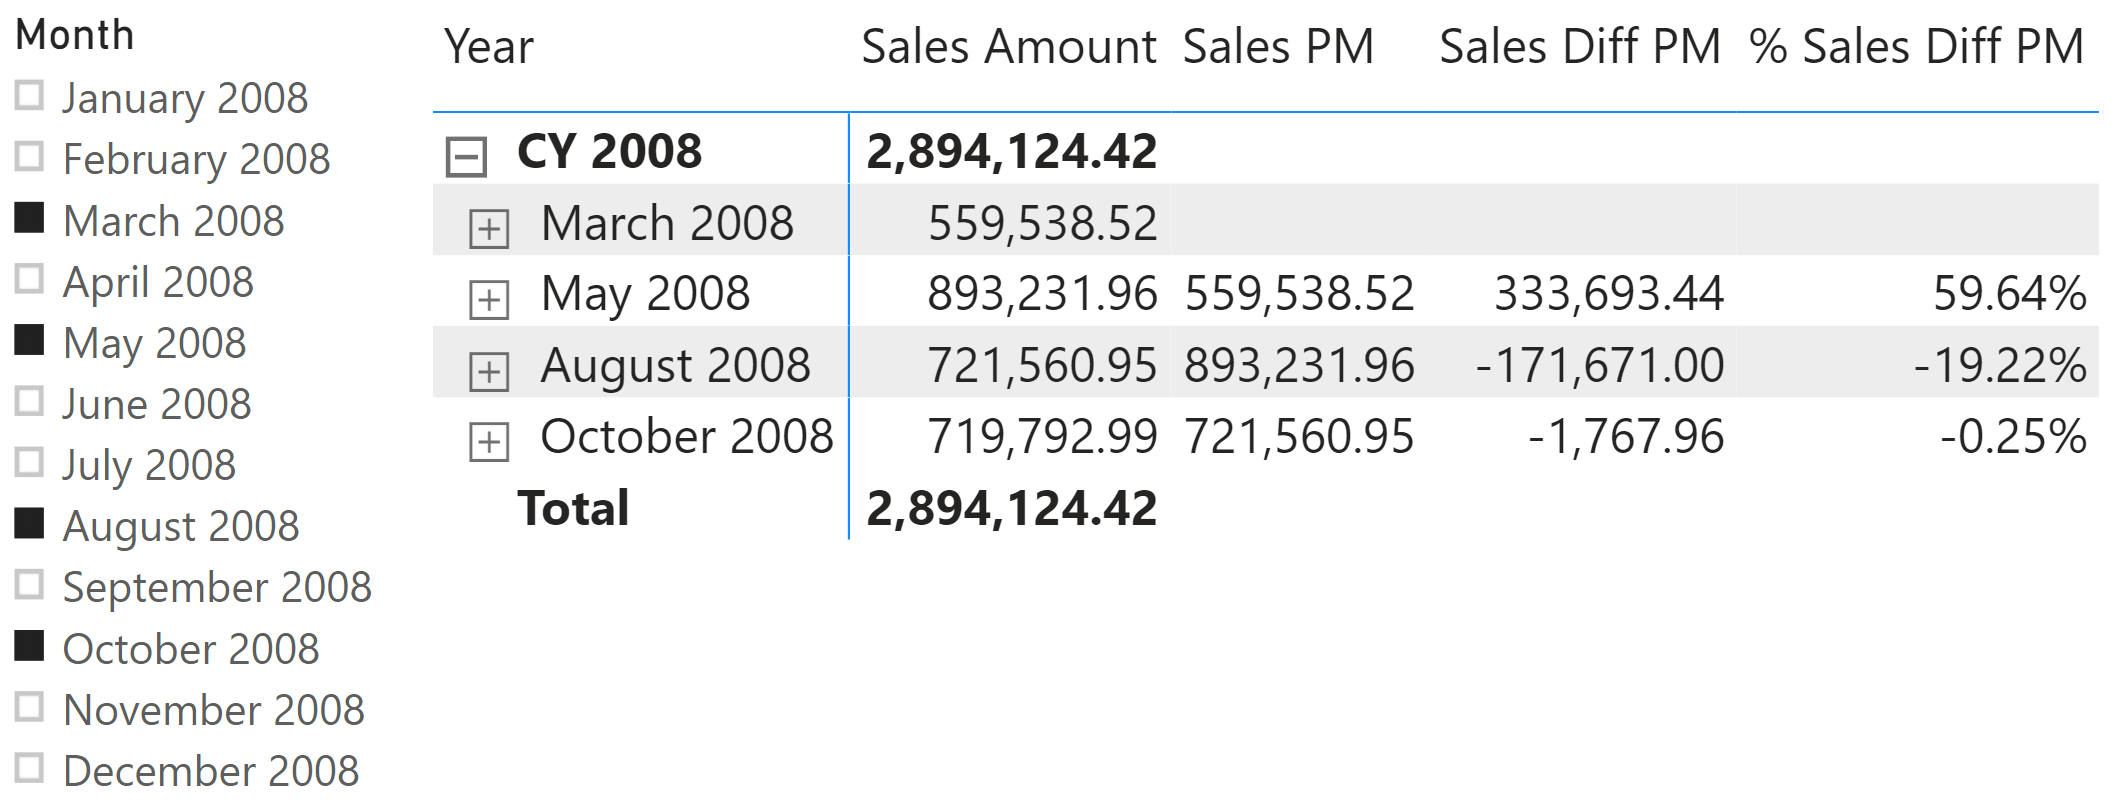
This article describes how you can create a comparison with the previous time period in a visualization, regardless of whether the time periods are consecutive or not. Read more
-
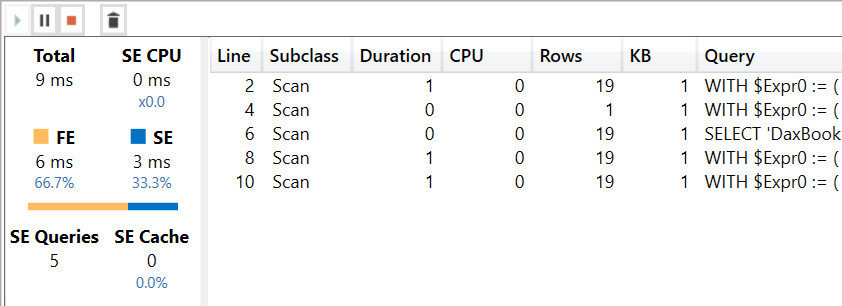
This article describes the differences between eager evaluation and strict evaluation in DAX, empowering you to choose the best evaluation type for your data models. Read more
-
This article shows a basic technique used to sort months according to a fiscal calendar, by using a couple of calculated columns and the “sort by column” feature of Power BI. Read more
-
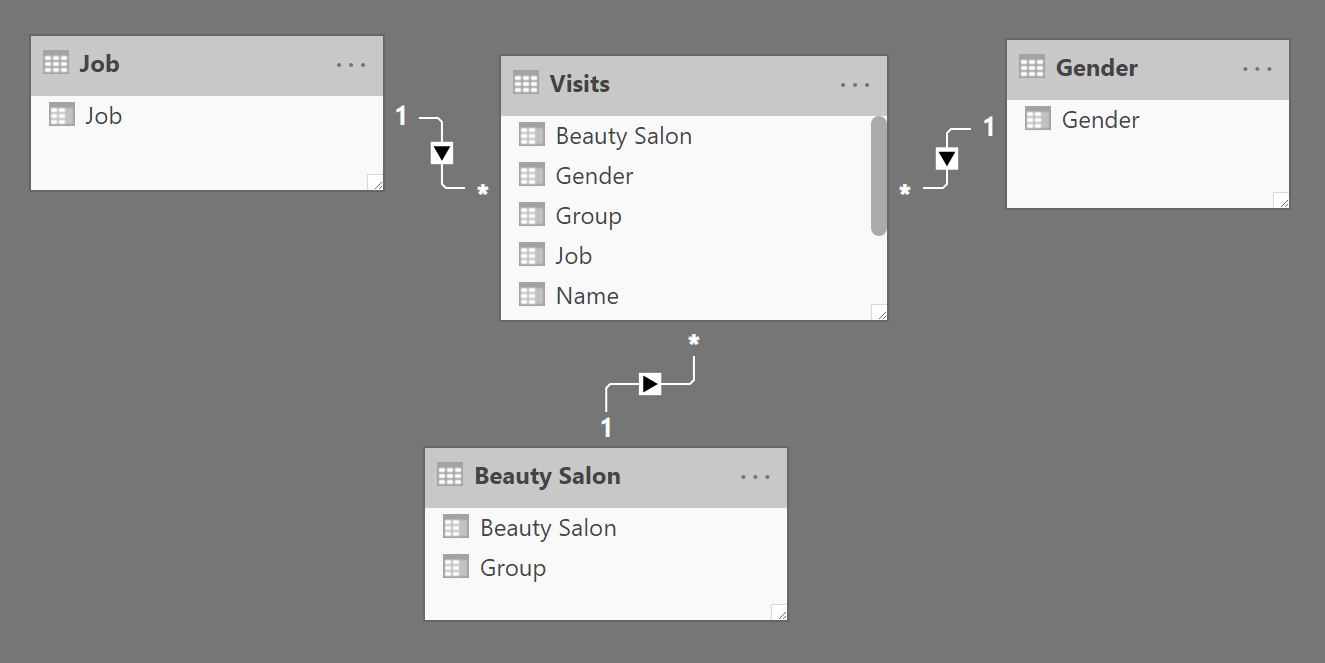
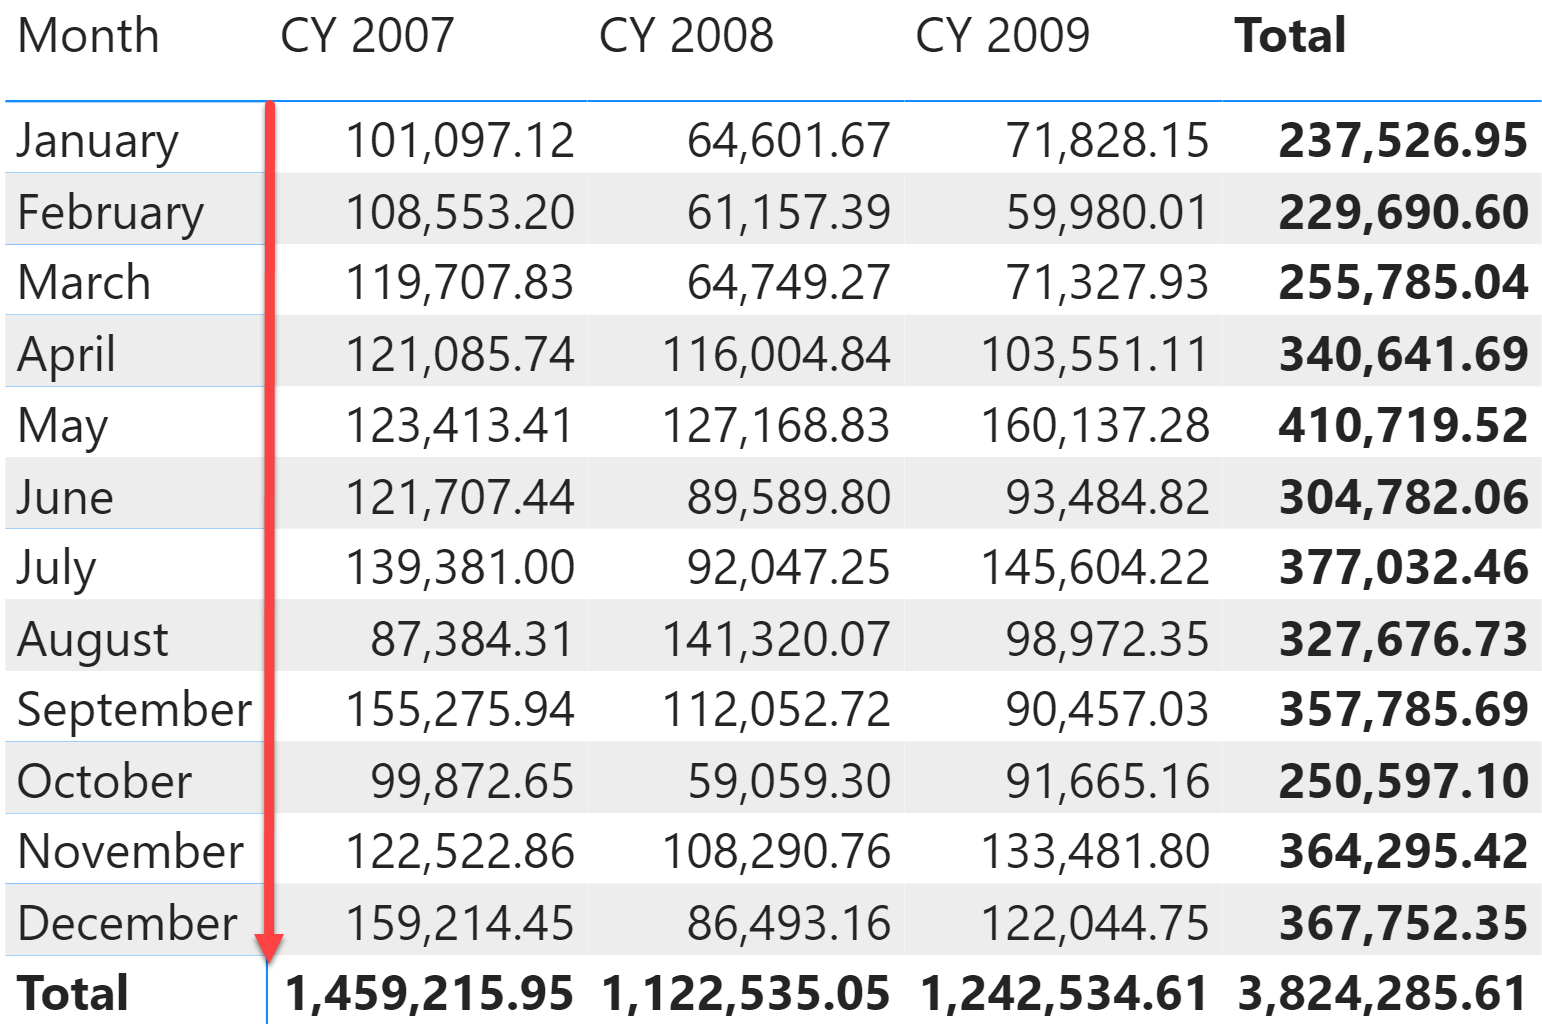
Creating a star schema in Power BI is the best practice to improve performance and more importantly, to ensure accurate results! This article shows why a star schema can fix some of the issues in your report. Read more
-
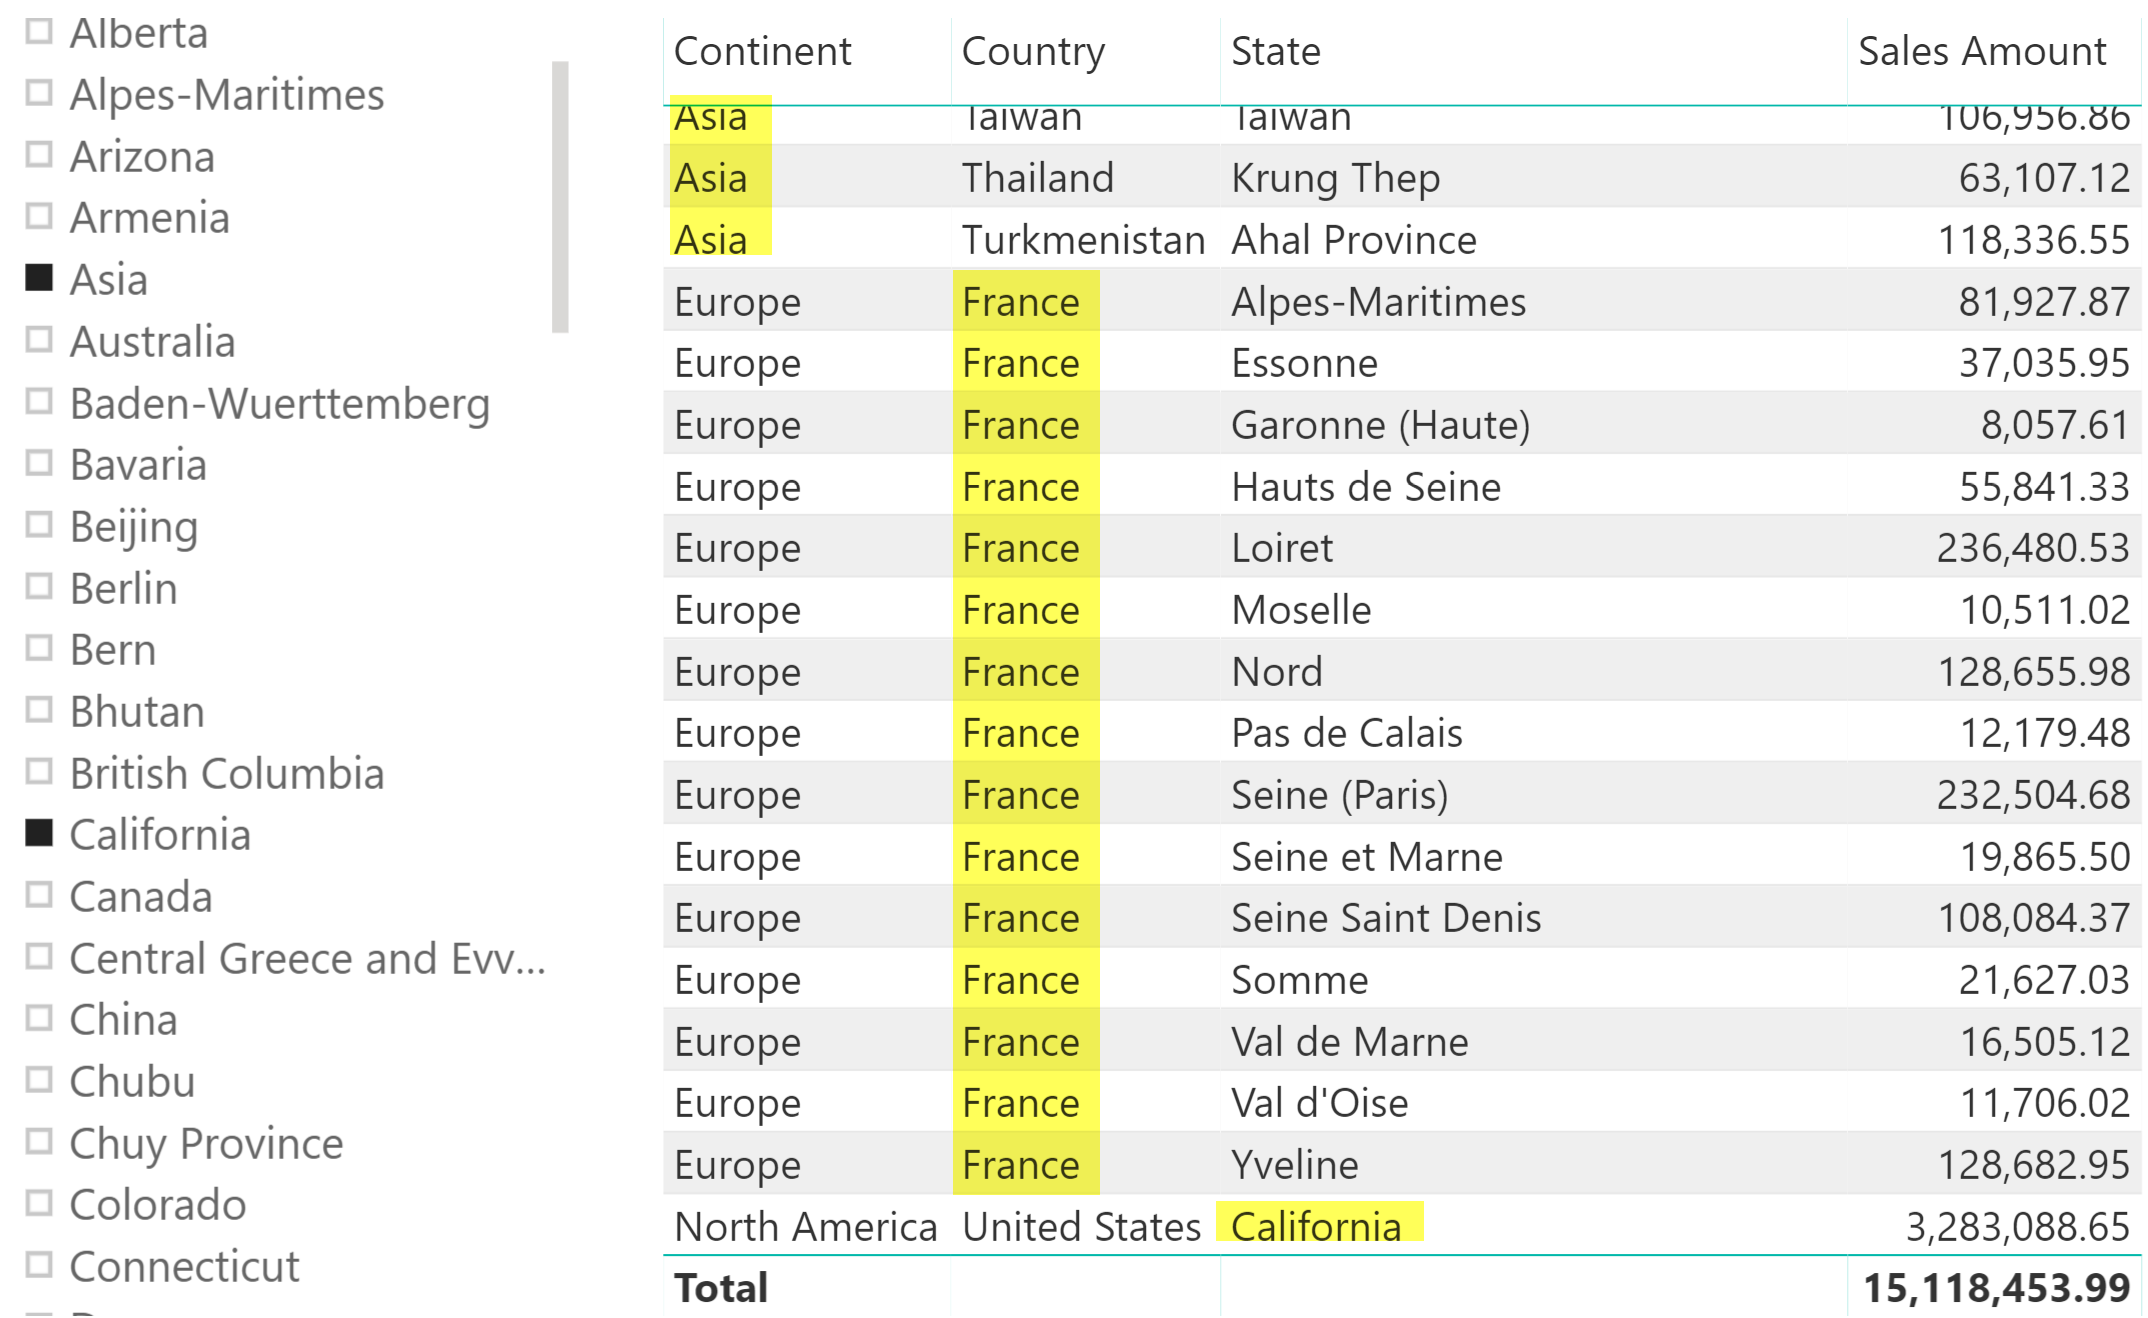
This article describes how to create a slicer showing the values of multiple columns, applying the filter on any of the underlying columns. Read more