Topic: Power BI
-
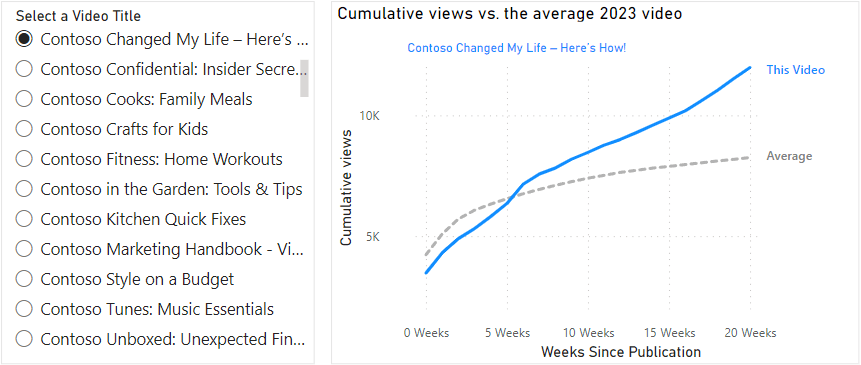
This article describes how to compare time series that occur in different periods by standardizing the timelines to days since a specific event. Read more
-
Learn how to use the new DAX window functions (INDEX, OFFSET, and WINDOW) to manipulate tables by sorting and partitioning data. Read more
-

This article describes how you can use a scatterplot visual to make more effective Power BI reports. Read more
-
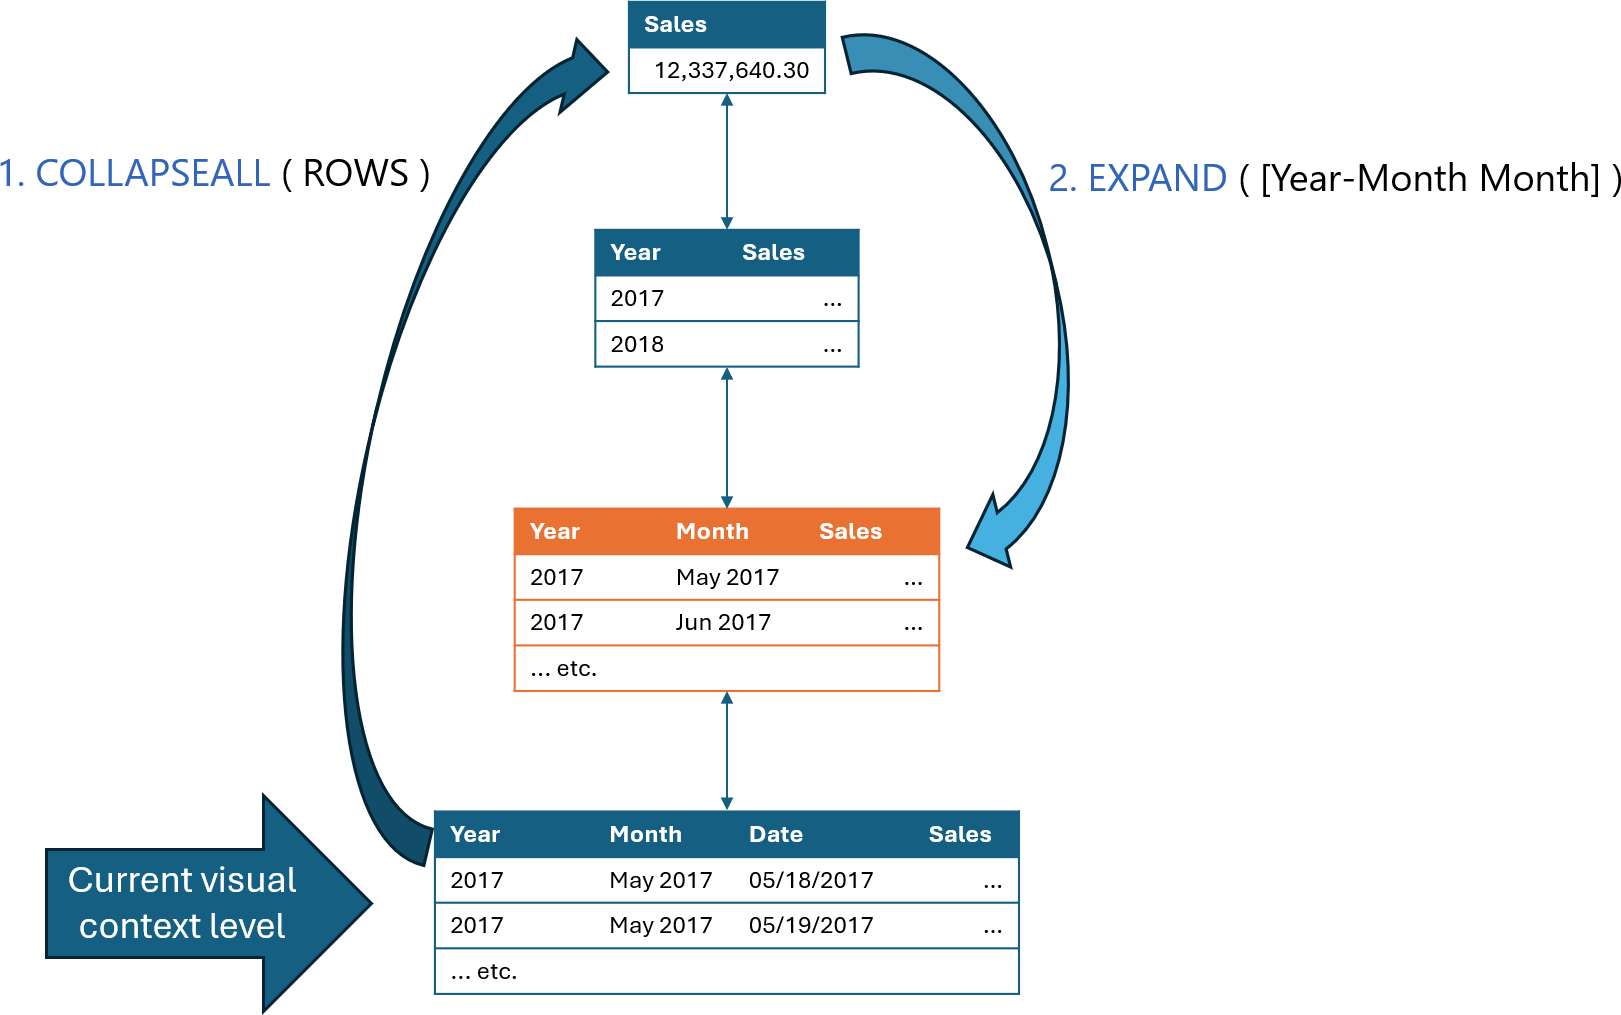
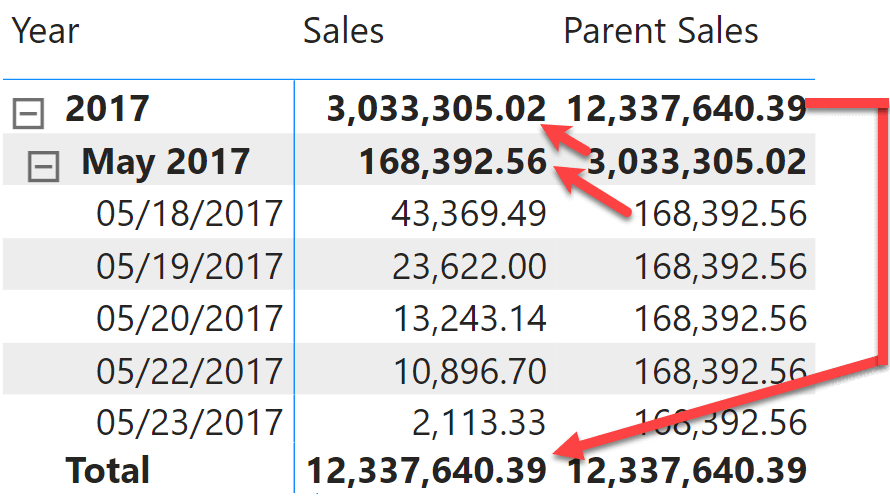
This article provides examples of visual calculations where the use of EXPAND and COLLAPSE is required to obtain the correct result. Read more
-
This article introduces the two basic visual context navigation functions: EXPAND and COLLAPSE. Read more
-
Visual calculations are a new feature in DAX that aims to simplify the use of DAX for users by introducing calculations at the visual level rather than at the model level. Read more
-
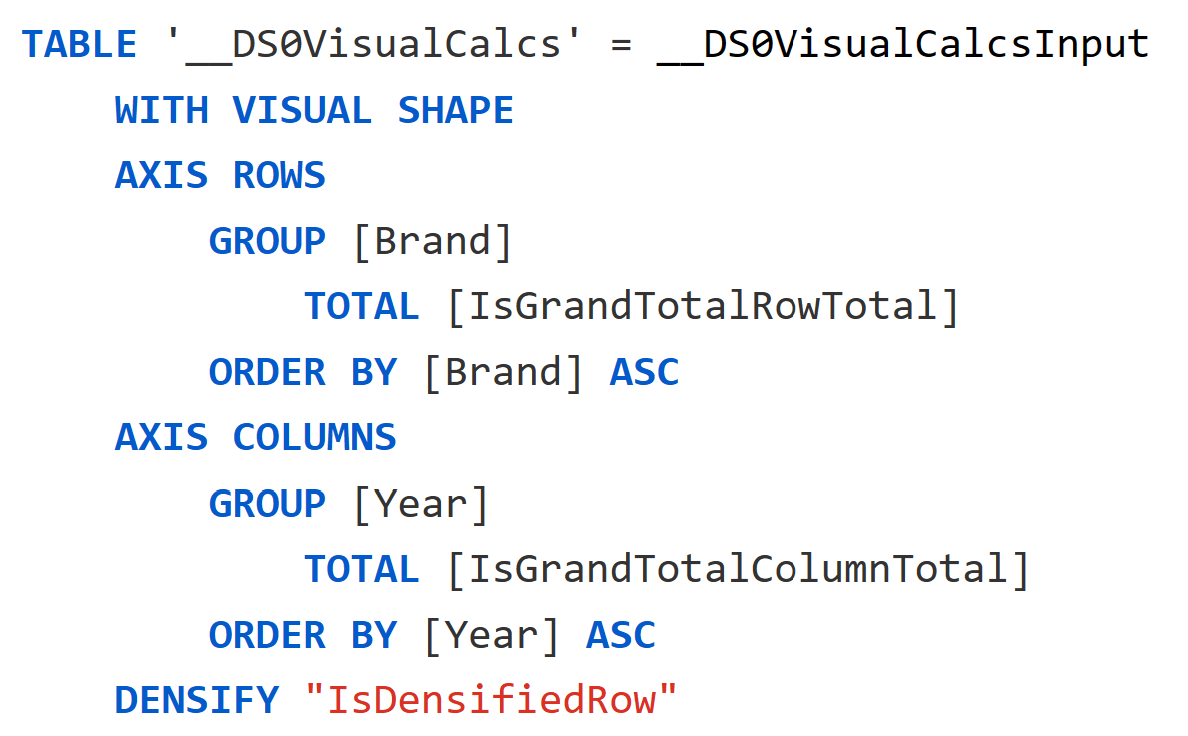
This article introduces the VISUAL SHAPE clause, which defines a hierarchical structure for a table used in visual calculations. Read more
-
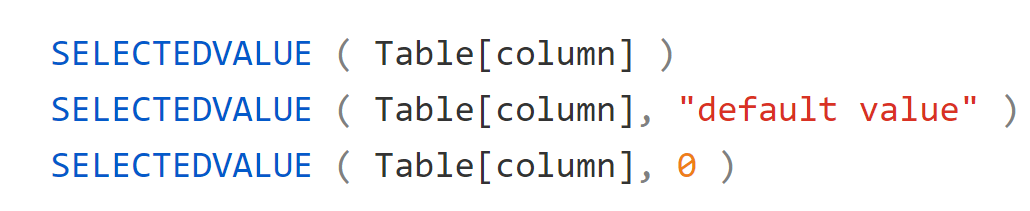
This article describes how the SELECTEDVALUE DAX function simplifies the syntax required in many scenarios where you need to read a single value selected in the filter context. Read more
-
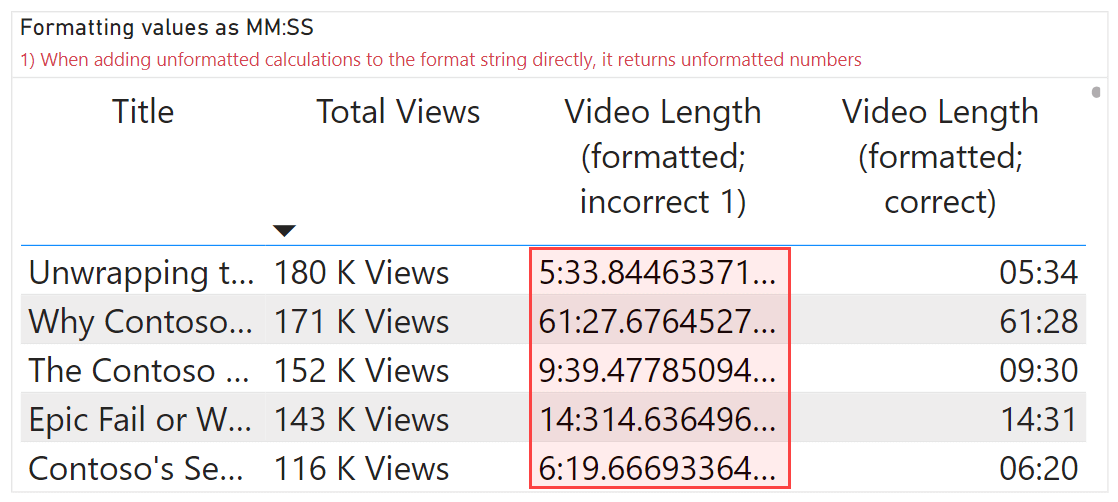
This article describes the different approaches to format your DAX measures in Power BI semantic models using format custom and dynamic format strings. Read more
-
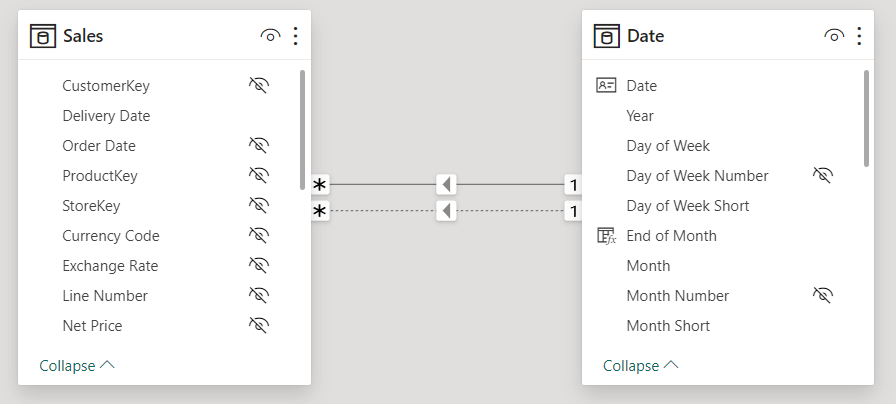
When you apply row-level security to a semantic model, there are limitations in using the USERELATIONSHIP function. This article shows the issues, provides a workaround, and its restrictions. Read more