
What is Report Analyzer?
Power BI is an extremely potent tool for creating reports. With such powers at the fingertips of everyone from seasoned report developers to regular business users, some patterns and features are bound to be implemented even though they are seen as bad practices by many subject matter experts.
Or even just not following company guidelines on accessibility or branding.
Anything from putting too many visuals on a single page, making it slow and cumbersome to use for end users, to forgetting to make the slicer that your company guidelines demand every report should contain.
And don’t even get me started on color choices for charts and indicators.
Until now, the report review process has been a manual process with the possibility of human errors and a lot of time consumed for something that should have been a relatively simple task.
Enter the PBI Explorer’s Report Analyzer.
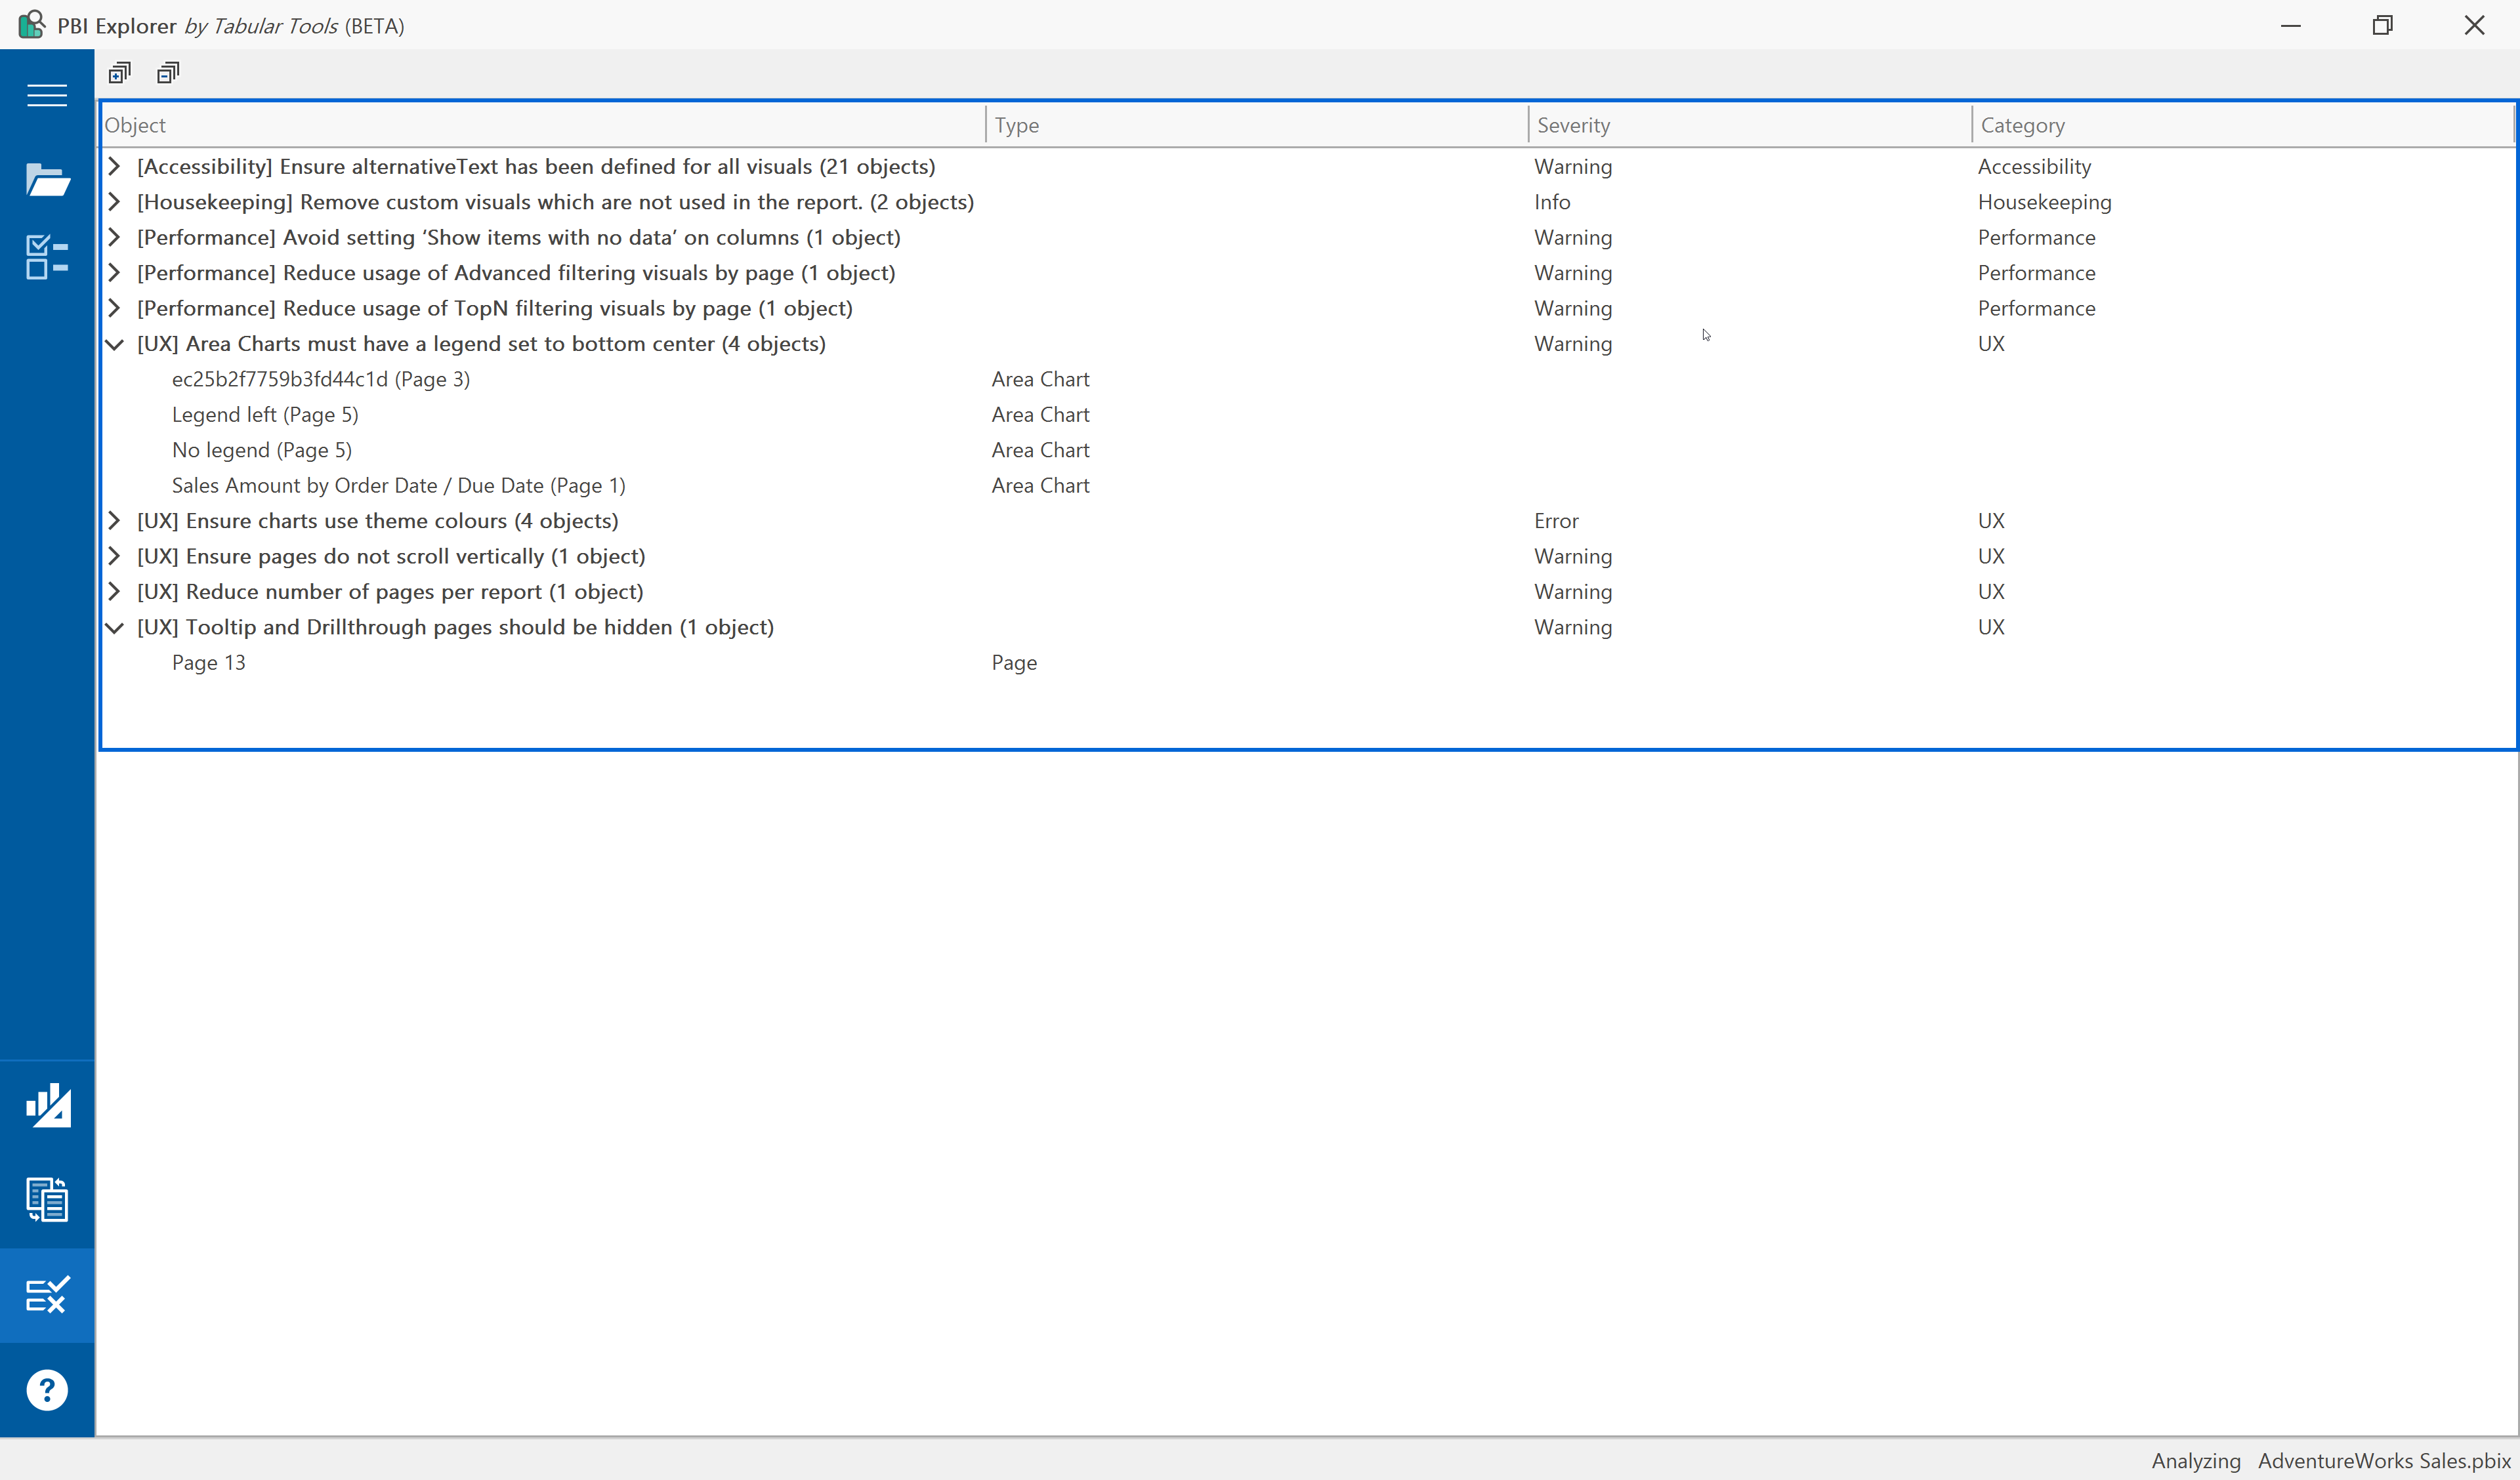
We have created Report Analyzer in PBI Explorer to help you deal with all this simultaneously. You can ensure that your report doesn’t contain any anti-patterns or bad practices, isn’t living up to the community’s best practices for report design, and even make sure that your internal company guidelines on layout and design are being met.
If you are familiar with Tabular Editor (2/3) and its Best Practices Analyzer, the Report Analyzer offers a similar experience. However, instead of analyzing the semantic model, it analyzes report components like pages, visuals, filters, etc., which define the end-user experience presenting data from the semantic model.
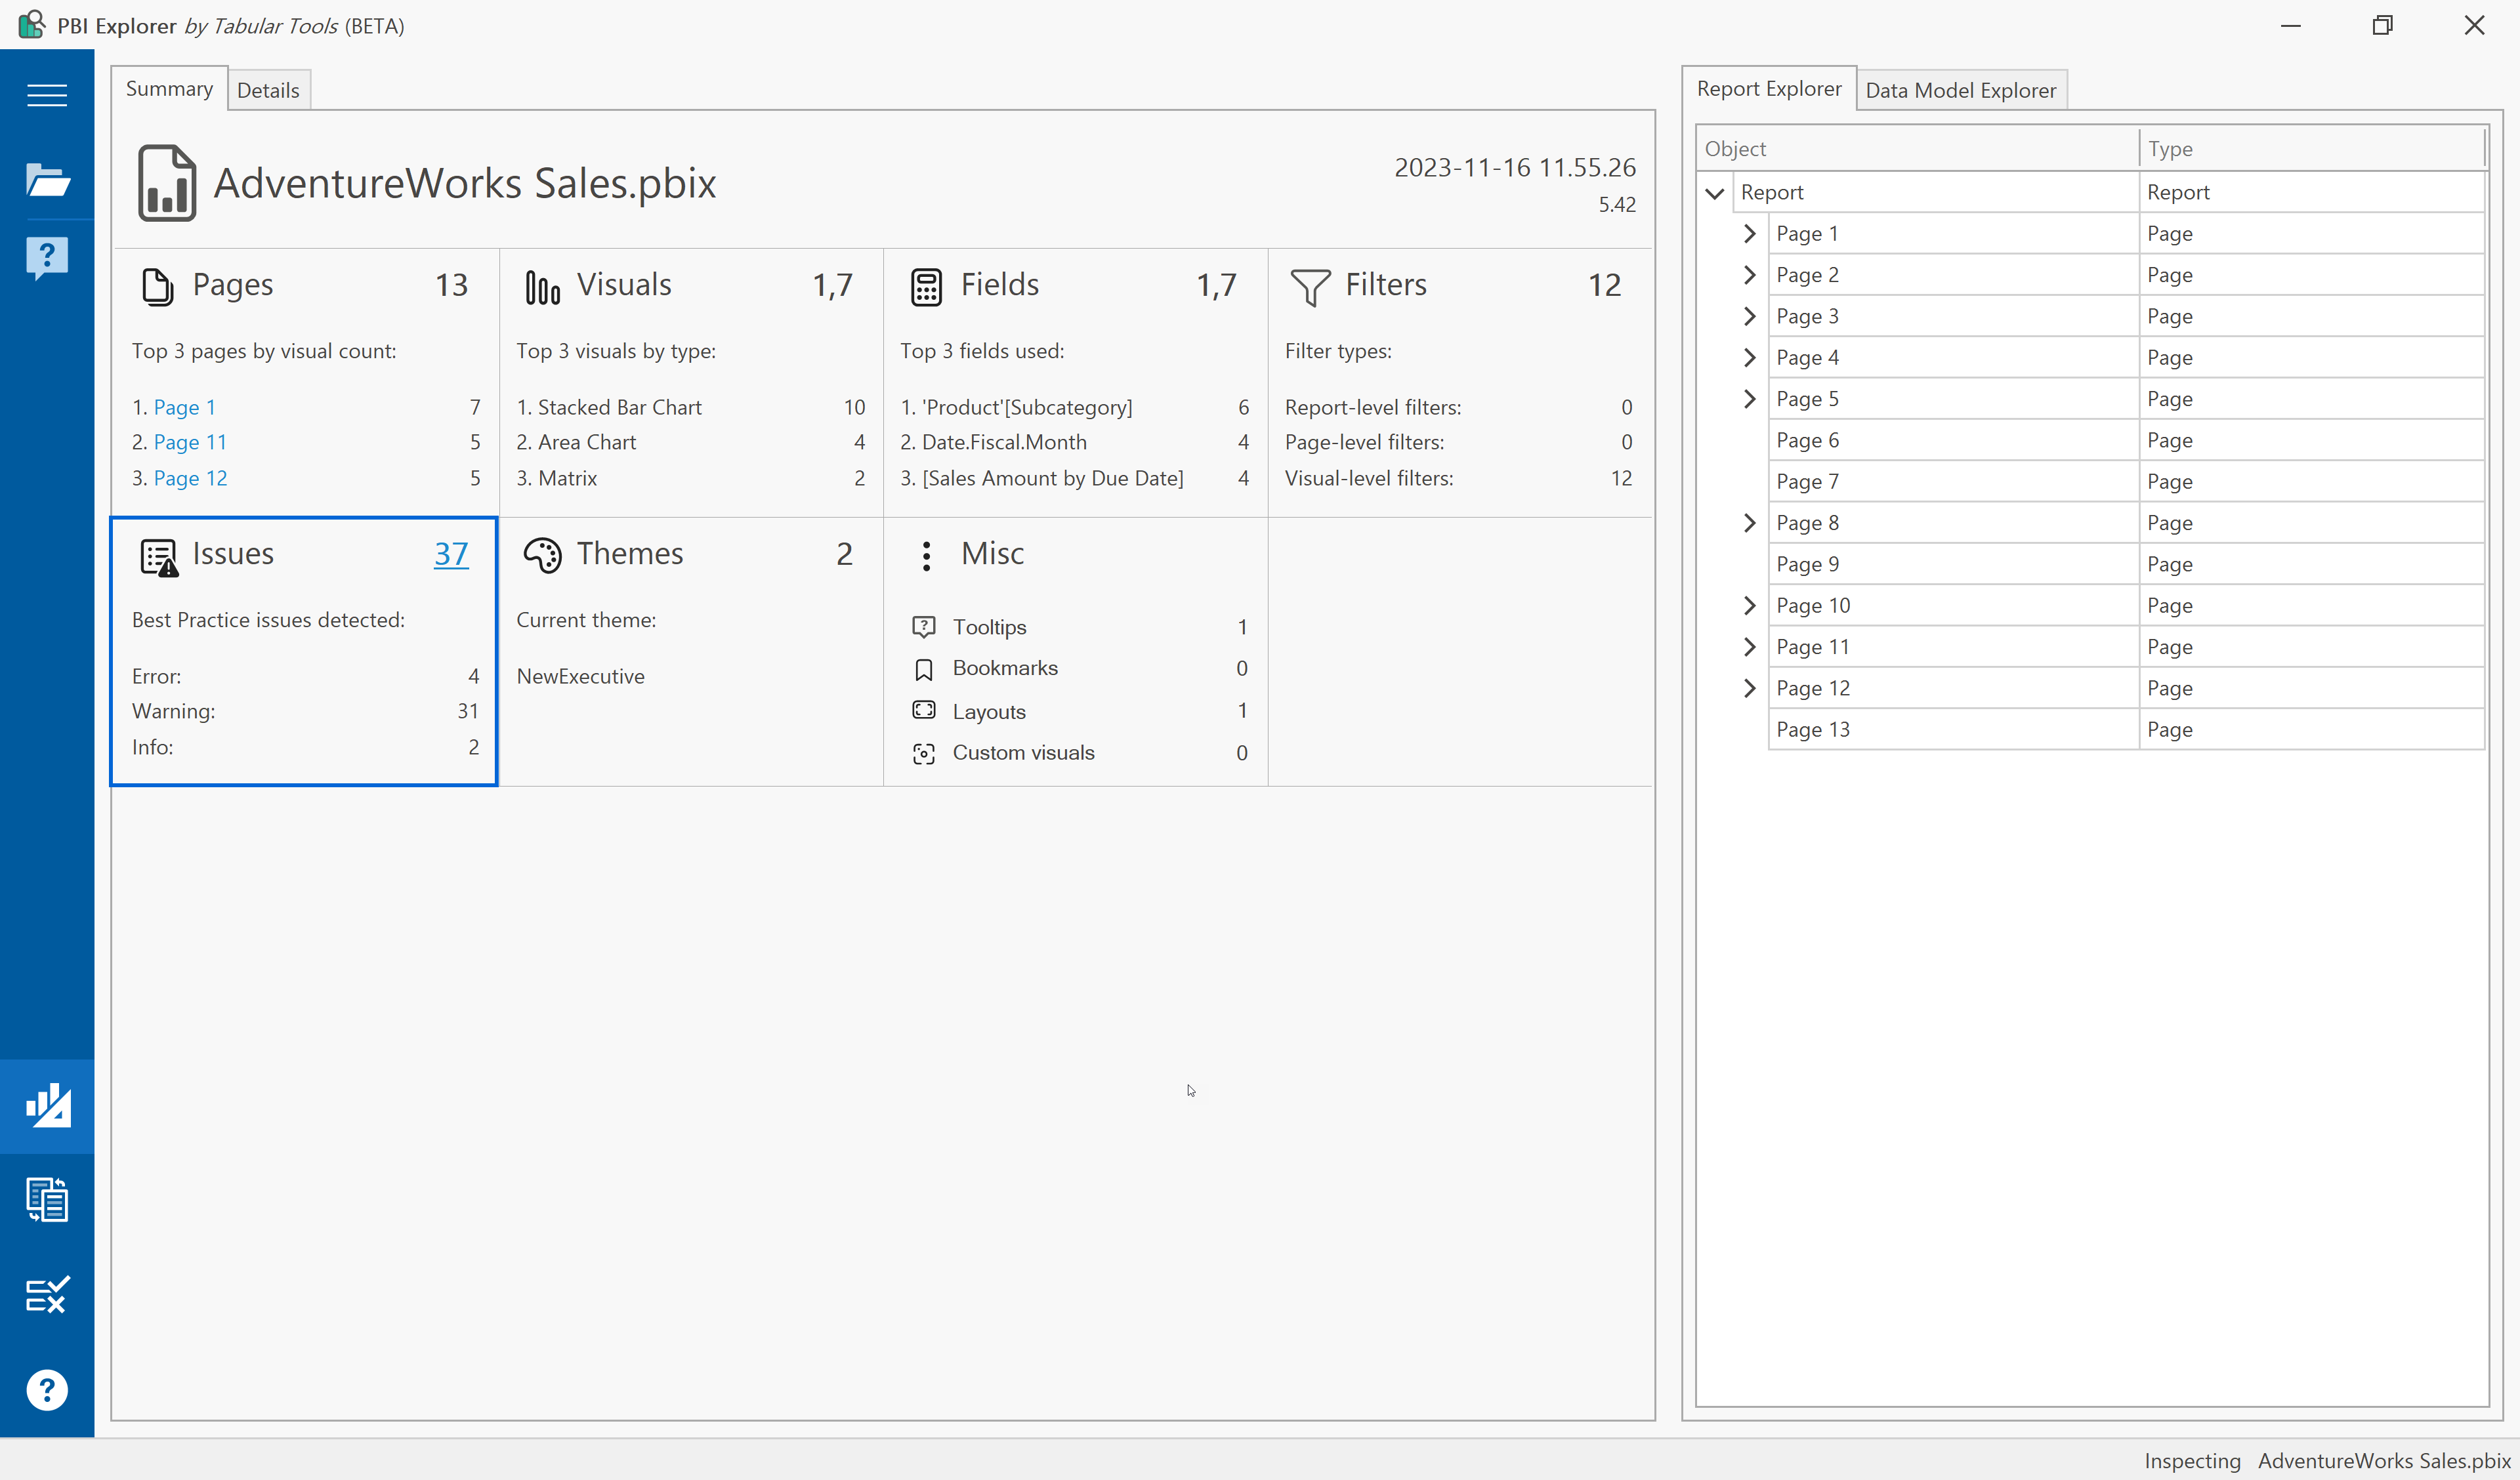
A more detailed explanation is that Report Analyzer examines all the aspects of your reports: every property on the reports itself, all its pages, all data visualizations (bar charts, line charts, matrices, …), filters on report/page/visual level, and even which custom visuals the report is utilizing. The analysis aims to validate their adherence to a dynamic set of best practices expressed as individual rules.
Rules can target different scopes and will be evaluated in that context. The list of supported scopes includes Report, Page, and Visual. This list will grow and adapt organically as we get feedback from the tool’s users.
The anatomy of analyzing reports
As with so many other things in life, a lot of effort must be put into hiding the complexity to make something simple and easy to use for end users.
In a tool like PBI Explorer, the key component is the object model, of which end users see less than 5%. It is a complete and extensive model exposing any property that can be part of a report while also hiding the complexity of the JSON format used to persist the properties in the PBIX file.
The object model allows you to build rules without learning the complex JSON format used to store the Power BI reports.
How do you define/modify rules?
Right now, you’ll have to edit the JSON file manually in your favorite JSON editor (mine is VS Code), but this is not our end goal. Soon, we will have full UI support for adding and editing rules.
We are also considering ways of going beyond personal rule sets on your local computer or git repo, but it is still too early to disclose anything about future plans.
We have been engaging closely with community members to build a set of community best practices. These rules will be added incrementally in coming releases.
What will happen with the feature going forward?
First, we are working on embracing all the features of the report in our object model. We still have outstanding tasks regarding the more complex (and rare) filter types, bookmarks, and custom visuals.
Simultaneously, we are developing a user interface for modifying and adding rules and rule sets.
Eventually, we want to provide a CLI (Command Line Interface) tool, enabling organizations to run Report Analyzer as part of pipelines for pull request validation and more.