

How to manage “Reporting Objects” in a Power BI Dataset
MAKE A DATASET THAT EVERYBODY CAN USE
…by using and managing report-specific objects properly in your Power BI solution.
No time to read a long-form article? That’s fine! This article has an audio version that you can listen to in the background while doing other things. Goblin drawings & cartoons are only in the article, though!

LAYERS IN A POWER BI MODEL
Your datasets should support effective, flexible visualization, while also being easy-to-use for developers & data consumers. This can be challenging in Power BI, since the dataset contains logic for both data and report visuals. Power BI is a model-based tool, although developers need to add model objects (like tables, columns or measures) to support specific visual or reporting requirements.
There are two kinds of objects in a Power BI model - semantic model objects and reporting objects.
Semantic model objects: These are the core objects of your model, containing the data, business logic and aggregations.
For example, A developer creating a new visual can add a measure [Gross Sales] to a table.
This measure contains the total sum of the ‘Invoices’[Gross Sales] column.The table is then sliced by a particular dimension, ‘Product’[Brand].
They may also add a page-level filter to return data for a single ‘Date’[Month].
The objects added to the visual so far are semantic model objects.
Reporting objects (or report-specific objects): In contrast, reporting objects fulfill specific visual requirements like aesthetics or functionality.
The developer may need to color the brand labels according to the brand colors.
To do this, they add a measure, [Brand Color], which colors the rows by their brand color.Users want to be able to switch between the brand name, brand class and brand type.
To do this, the developer adds a field parameter. A field parameter enables dynamic selection of dimensions and measures from slicers.Users want a concise view on month-to-date sales without overloading the table.
To do this, the developer can add a small chart for each row in the table. This is called a scaleable vector graphic (SVG) microvisualization. These charts render from dynamic HTML code the developer creates in a DAX measure, tailored to this custom visualization.
These last examples are report-specific objects. They allow flexibility and customization of report visuals. However, report-specific objects create challenges for developers and end-users using the model to create new content. These objects typically only work with specific client tools, visuals or evaluation contexts. In the wrong scenario, they produce incorrect or confusing results. Further, they can quickly overwhelm or pollute the model, confusing the person using it. Even when hiding these objects, they still appear in intellisense when typing DAX. They can also be revealed by right-clicking the “fields pane” in Power BI Desktop and selecting “view hidden”. Because of this, report-specific objects can hurt both the sustainability and adoption of your dataset. How can we use and benefit from report-specific objects, while preventing them from making a model that’s hard to use?
In this article, we describe report-specific objects, how to use them effectively, and how to mitigate negative impacts for developers and end-users of your model.
First, we’ll differentiate between a report-specific object and a semantic model object, describing the types of report-specific objects that exist today and those which may arise in the future.
We’ll look at the different data model usage scenarios in Power BI (read-only and build models), highlighting when report-specific objects need special consideration.
We conclude with a proposed set of best practices to handle report-specific objects in a Power BI dataset, and considerations for the broader Power BI ecosystem.

POWER BI REPORT-SPECIFIC OBJECTS
I. INTRODUCTION: What are report-specific objects?
II. DATASET SCENARIOS: How do they affect users and developers?
III. PROPOSED BEST PRACTICES: How can we manage them, properly?
I. INTRODUCTION TO REPORT-SPECIFIC OBJECTS

In any report, we must tailor the user experience to the end-users. Depending on the question being addressed, there is a preferred, optimal way to display and interact with the information. While we can tune visual settings, generally, there is only so much flexibility that a user interface can afford. For this reason, Power BI allows developers to create report-specific objects in the data model to achieve tailored reporting experiences.
WHAT ARE REPORT-SPECIFIC OBJECTS AND WHY ARE THEY CHALLENGING?
Report-specific objects are any object in a model created to fulfill a specific reporting requirement. Unlike other objects, which are used ubiquitously across client tools, reports, visuals and filter contexts, report-specific objects are designed to achieve specific aesthetic or functional outcomes in a report. Because they are created for a specific context, they also present a unique challenge.

If these objects are evaluated outside of this situation, they might produce unexpected, nonsensical or even incorrect results and errors. They require explicit information to understand and use. Users with build permissions that connect to a dataset may be confused, overwhelmed and frustrated by the many objects that don’t seem to work. For users new to building content from a central Power BI dataset, this gives them the impression that the tool or dataset is unreliable and hard-to-use. This hurts adoption in self-service scenarios.
As more reports are created from a central dataset, these report-specific objects quickly accumulate. This makes the model difficult to manage and use, even for experienced developers. Even if the original developer spends significant effort to organize the model, report-specific objects will still appear in intellisense, even if hidden.
Note: This example used to be an interactive Power BI report. I’m currently migrating all my content to Microsoft Fabric; interactive examples are temporarily replaced with static images.
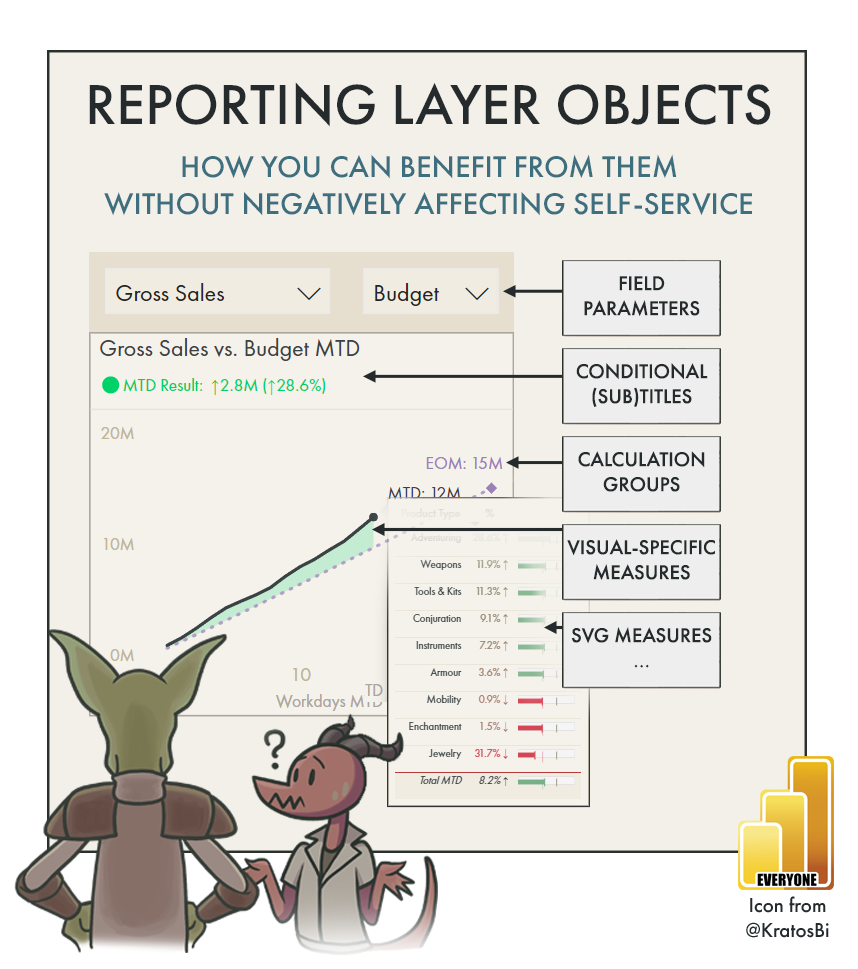
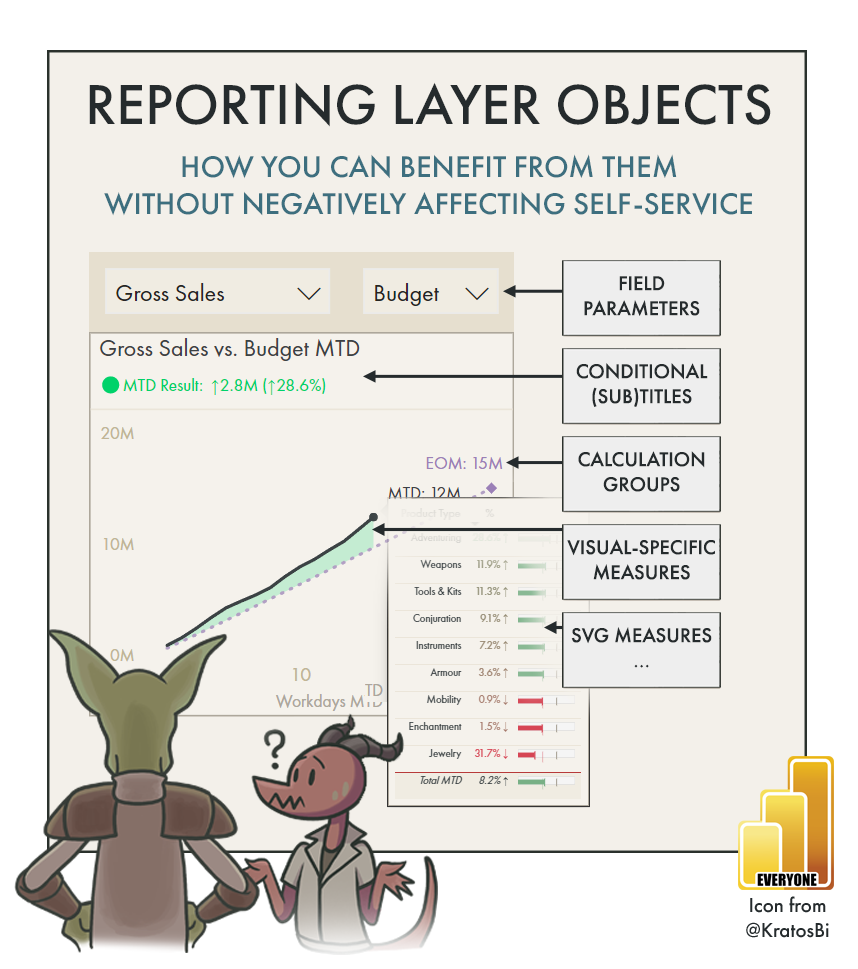
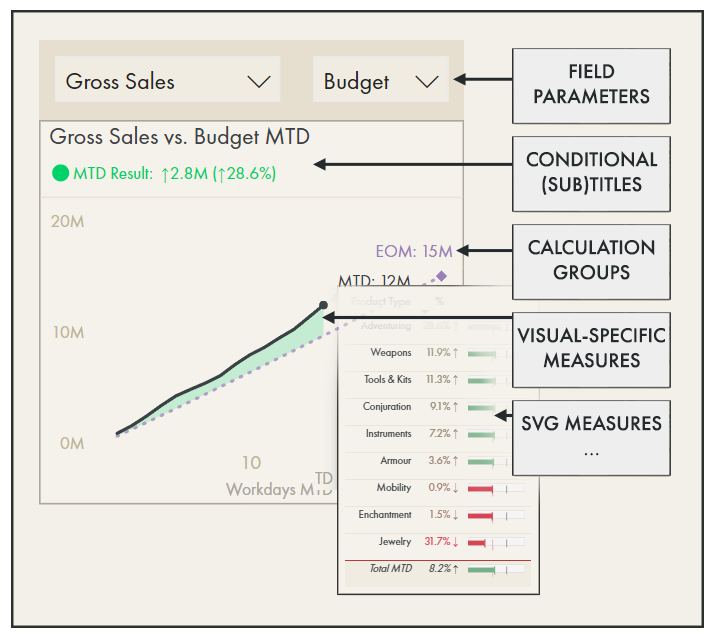
Field parameters:
Dynamic selection of actual or target give users flexibility to tune the analysis to their needs.
This makes the visual more flexible and fit a broader set of use-cases, extending its lifespan.Dynamic titles:
Depending on the selections, the title will update to show a clear message.
The subtitle gives a KPI summary of the below visual so it’s easy to see if we’re on target.
These titles make the visual clearer and help the reader quickly see if they’re on target.Title colors:
A measure returns a hex code to color the subtitle depending on the MTD achievement.
This is re-used across the report to keep achievement color-coding consistent.Month-to-Date (MTD) and End-of-Month (EOM) Markers:
The latest date for values are marked with a shape, so it’s easier to spot and label.MTD and EOM Labels:
The markers are labeled with the value and a prefix to show what they are.
It’s a standard convention in reporting for this org., and makes the visual easier to use.Between-Line Shading:
The gap between lines is shaded green if it’s above and red if it’s below target.
This makes it quicker to tell the MTD performance at-a-glance.SVG Bulletchart:
For a quick breakdown, a custom SVG visual shows MTD achievement by key customer.
This tailored visual makes it quick & easy to see top/bottom performers.
REPORT-SPECIFIC OBJECTS: ARE THEY HACKS OR ACTUAL FEATURES?
Power BI provides a low-code data visualization experience, and report-specific objects are a way to squeeze additional flexibility from the user interface. Despite the challenges, report-specific objects are features endorsed and supported in Power BI; it’s not a ‘hack’ or de facto ‘bad practice’ to use them. Report-specific objects are necessary to make good reports.
Without them, it would not be possible to achieve many popular and valuable functionalities. They are common, and will only become more so as business users increase their visualization skills and Power BI extends its visual functionalities.
Below are some benefits report-specific objects provide to Power BI report.
Field parameters and calculation groups let user selections drive what data is displayed and how it is formatted in a report. This enables concise and explorative experiences where a few interactions let users go from overview to detail, getting the data they need when they need it without having to ask for new views or learning to create their own reports.
Measures that conditionally color or label chart elements draw attention to important data points, focusing user attention where they should look so they get insights, faster. As a result, users don’t waste time digging through the “sameness” of a table or visual and can immediately proceed to investigate or act on the data point that drew their attention.
Measures can return dynamic titles that better inform users about a visual or data context. Further, customized data labels with calculation groups or measure-driven data labels provide additional context for a data point, giving users a concise yet complete visual overview from which they can take better decisions.
Measures can render SVG graphics to produce self-contained, custom visuals for complete control of how information displays. This allows custom sparklines and small multiples, custom KPI cards and more, all only using the native visuals of Power BI.
OVERVIEW OF REPORT-SPECIFIC OBJECTS IN POWER BI
There are many different kinds of report-specific objects used in Power BI, today. They are popular sources of content to teach people tricks to improve their report designs; many Power BI YouTube tutorials focus on these objects, only. Below is a summary of common report-specific objects, with examples and explanations of how they work.
These measures generate descriptive text, for example for alt. text descriptions of visuals, which is used for screen readers. It can be used to pull information from the filter context to make dynamic alt text.

In the example, alt. text is generated for a screen reader for a MTD sales visual. Depending on the selection made by the user, the alt text will update to give informative context about the visual. The variables contain both the name of the selected metric and its value, properly formatted to be read by screen readers.
These measures generate a URL that can be used for navigation, for example with a button action, that directs the user to a website.
URLs can also be taken from columns for tables and other visuals.

In the example, a dynamic URL is generated to send the user to a different Power BI report with special filter parameters depending on the Key Account they select. See here about URL filter parameters.
Conditional text measures generate short text descriptions used in titles, subtitles and cards. They provide contextual information to understand the report based on the active filter context. For example, a title might take the selected value for measure selection of actuals vs. target to say ‘Sales vs. Budget’ if both sales and budget are selected, or ‘Sales vs. Forecast’ if the user selects ‘Forecast’ instead.
An extreme example is a conditional text measure that shows all the selected filters (active filter context), which is a popular requirement for interactive Power BI reports, particularly for users new to Power BI.

There are many ways that conditional text are used in Power BI. In the example, a dynamic title provides context for the visual, telling the user what metrics have been selected in a field parameter.
Hex color code measures are used in conditional formatting to render a color determined by the hex color code string. This is currently the only way to render transparency in Power BI visual elements. It’s also often used to have consistency in colored elements, for example for branding or style guidelines.
Colors could also be taken from columns for table and matrix visuals.
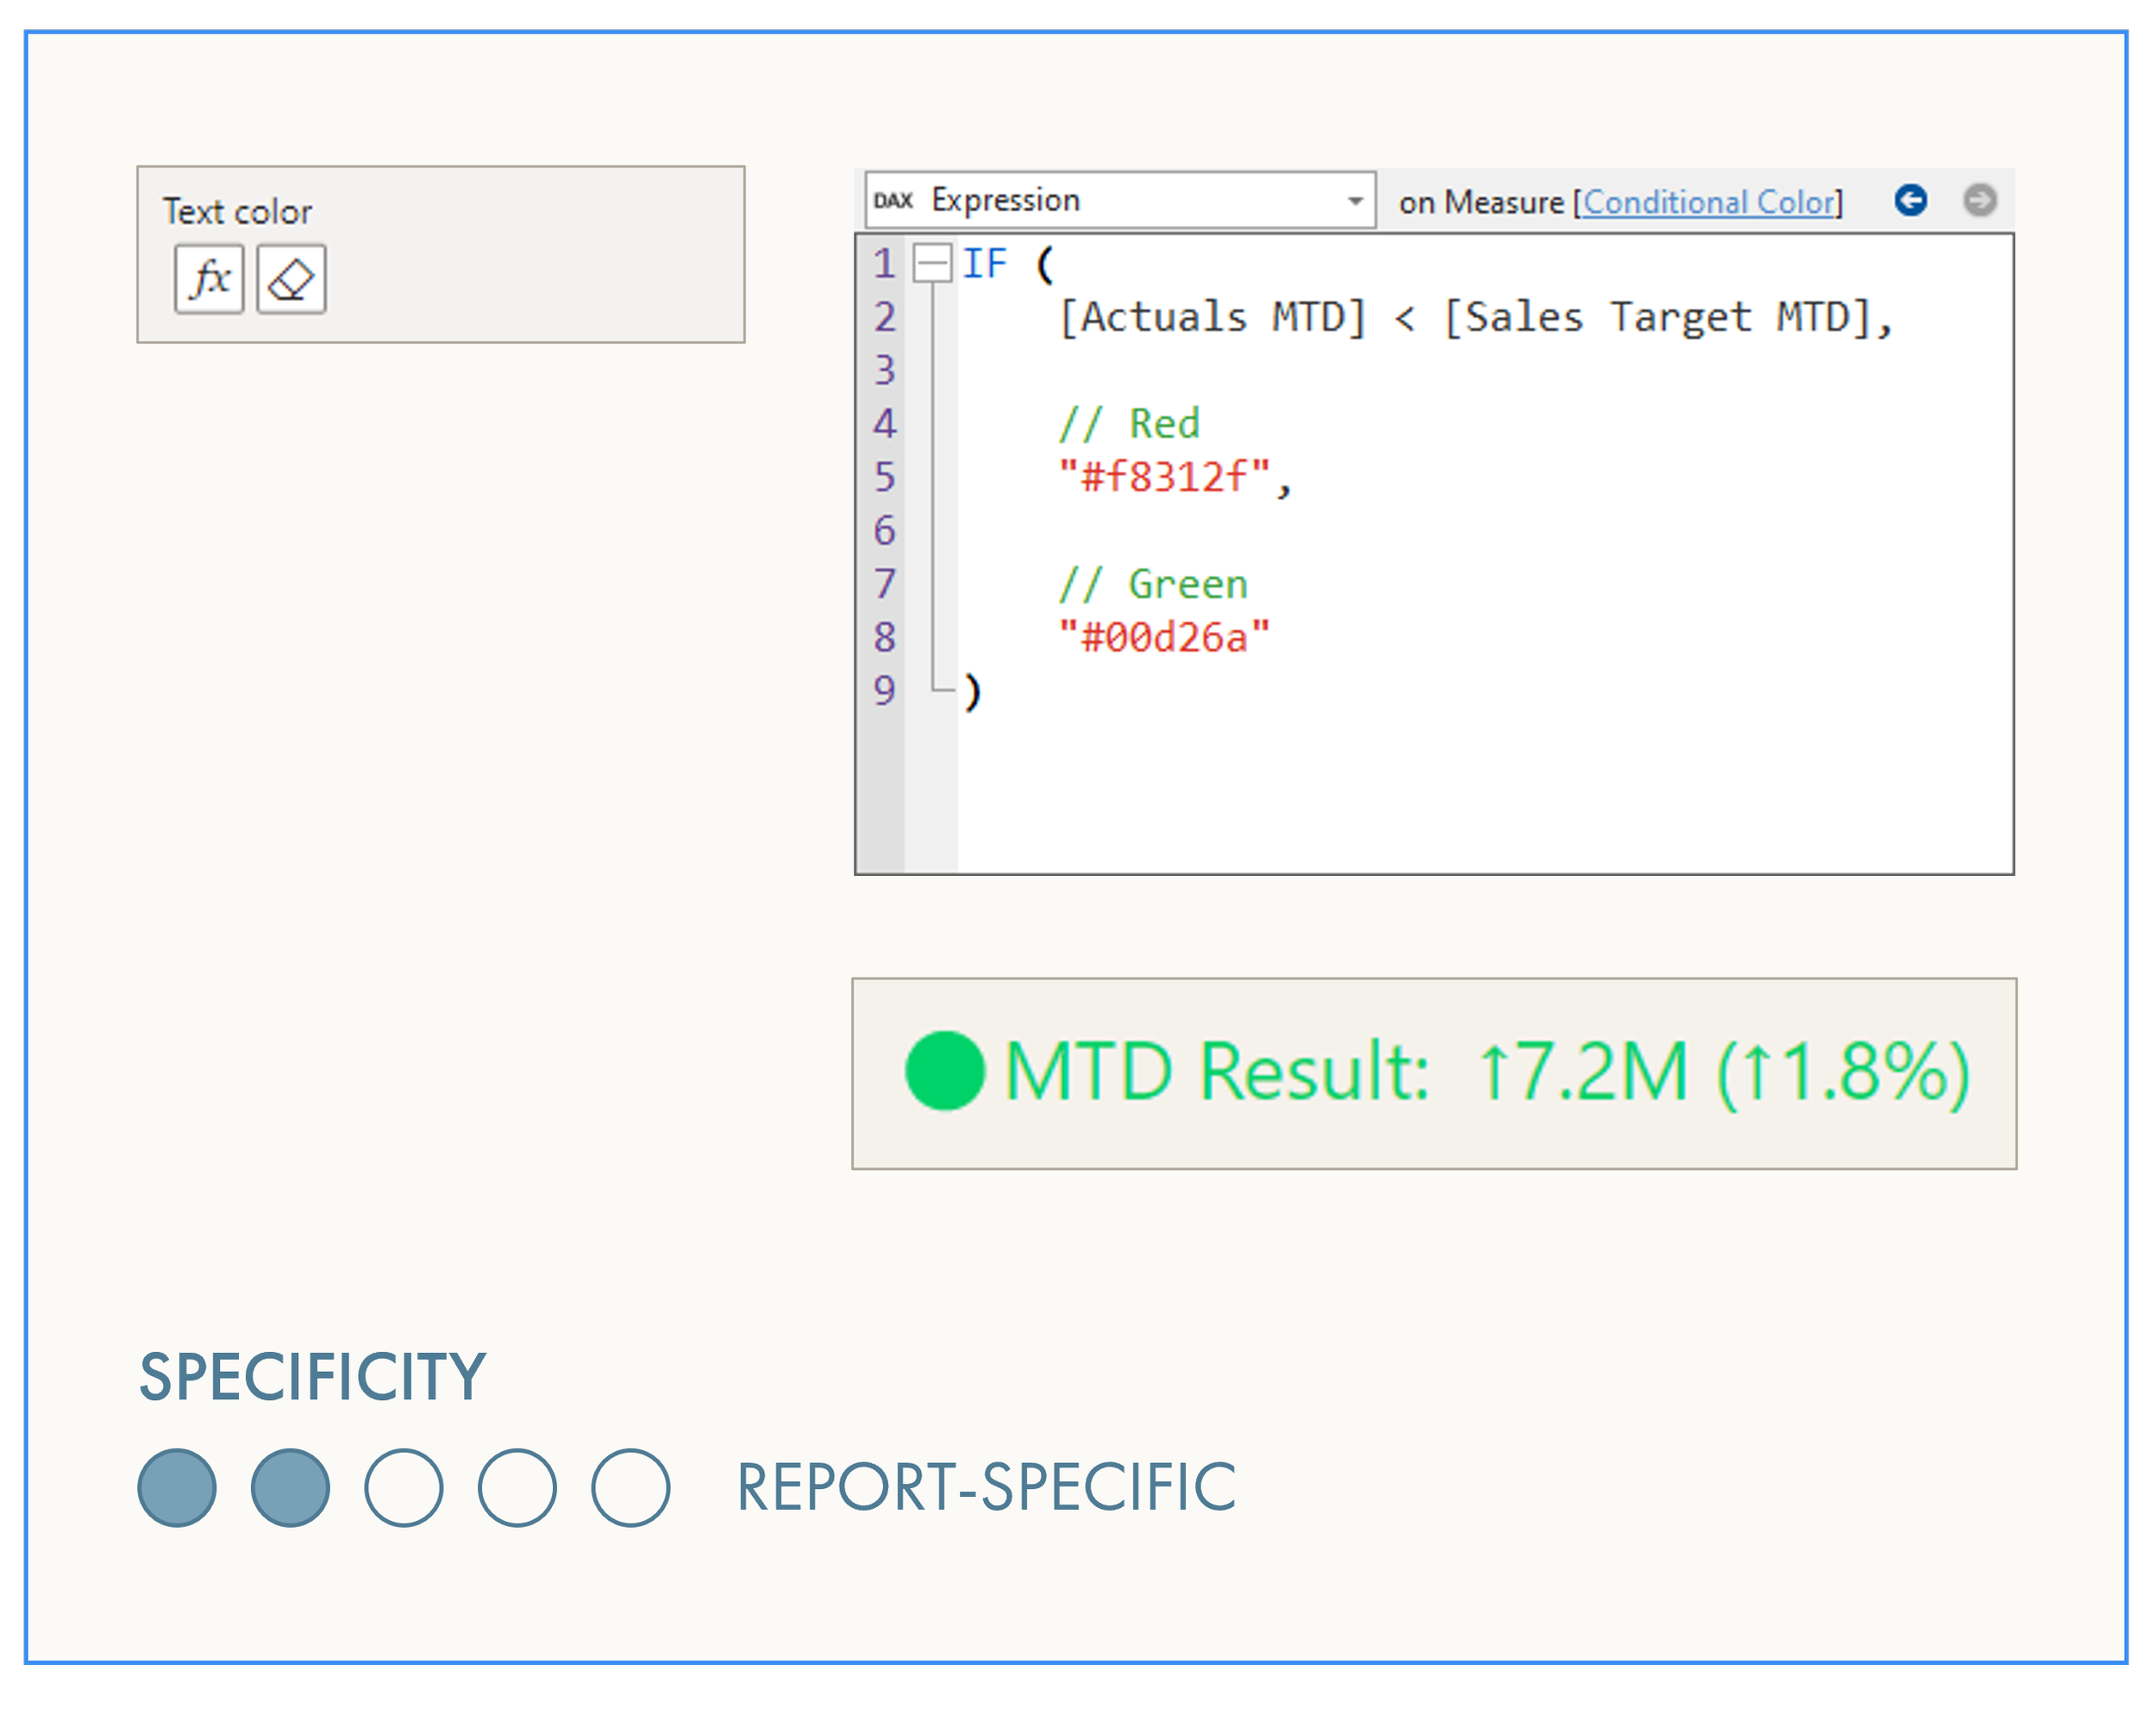
There are many ways that conditional colors are used in Power BI. In the example, a measure returns a different hex color code depending if the actuals are above or below the selected target.
Conditional transparency measures are Hex color code measures used specifically to show or hide an element depending on a condition. Common examples are shape containers placed on top of visuals, which render white in one filter context, blocking the visuals, and transparent in another, showing them for additional context.
There are many ways that conditional transparency is used in Power BI (since this is the only way to achieve transparency, today). In the example, a measure returns a different hex color code depending if the actuals are above or below the selected target. If it’s below, the visual object is transparent. If it’s above, it’s blue with 60% transparency. Note that transparency does affect emoji’s, but colors do not.
Dimension-limited measures are used to label or format specific data points differently from others. The most common example is to label the latest data point in the time series with a marker, whereas the rest of the series is unlabeled (no markers).

In the example, a dimension-limited measure is used to label the latest data point on a line chart that shows a time series of values MTD by workday. The dimension-limited measure allows a marker and data label to be rendered on a single data point-of-interest (indicated by a red arrow).
Axis-limit measures are used to set a dynamic axis range. This is commonly done to set the axis to be +15% higher than the highest data point, so that all labels can render “above” the shapes. This can also be done as an alternative to the “sliders” so that users can use “what-if” parameters to set a custom axis range.

In the example, a measure takes the highest value between the Sales Target and Actuals month-to-date, fixing the Y-axis or secondary Y-axis maximum to 115% of this value. This ensures the end-of-month label will render with sufficient space above the data point (indicated by a red arrow).
Constant line measures set a custom / dynamic line across the axis based on a measure’s evaluation. This is usually done to show a global target over all dimensions, or to visually divide the container in a meaningful way.
This can be done with quantitative values or dates.

In the example, the workday average is plotted against the daily sales. The average line can’t be used, as it would take the average across all days. Another example could have been using an X constant line to indicate the highest and/or lowest workday.
Error bar measures are used to display a specific variance, like the standard deviation or confidence interval about a measure of central tendency. They can also be used to create other interesting effects, like dumbbell plots or shading the area between curves.

Error bars are very ‘complete’ in terms of formatting and styling (unlike most of the other Power BI visual features). As a result, you can use them in a wide range of use-cases, such as shading the area between lines, like this example. When actuals are below the target, the shading is red, but if they are above, the shading is green.
SVG measures render custom ‘microvisualizations’ configured within a single DAX measure. They display the graphic as an image in supported visuals like tables and matrixes. This gives advanced developers the tools to make custom sparklines, KPIs, and more.
For examples of SVG microvisualizations, I suggest the portfolio / template site of Kerry Kolosko.
SVG microvisualizations are tailor-made solutions; because they are so specific, they are a lot of effort for others to understand and maintain. As such, you must take special measures (no pun intended) to ensure they are hygienic, documented and easily maintainable. Otherwise, you give some future developer a poisoned gift.
Use variables to store repeated and dynamic elements.
Things like width, height, colors, etc. should be encoded as variables and then concatenated into the SVG HTML code. These variables should be clearly named with respect to their purpose. A comment above them should explain what they do in the visual. This makes it easy for someone else to change or debug the visual.Don’t perform DAX calculations in the SVG measure.
Keep all business and calculation logic separated so that the SVG measure contains only the HTML code. This helps isolate the “parts” of the solution to keep it clean and easier to debug.Format the concatenated strings so that each part of the SVG visual is separated.
Logically isolate each part of the string that encodes different shapes, storing them as separate variables.In a PowerPoint slide or PDF, map each shape to its corresponding ‘section’ in the code.
You can do this with a simple diagram using alphanumeric labels. This most easily helps the person connect the code to the result.

In the example, a SVG bullet chart is in the third column of the table. This is produced from a DAX measure that generates the code, giving a concise overview of MTD performance and also relative position to the end-of-month target (dark brown line).
Blank/dummy measures are used to blank out a specific field or part of a visual, or as a placeholder in a DAX calculation. These could be with the BLANK() function, empty string unicode characters, etc. An example is when performing measure replacement, a technique with calculation groups to substitute a dummy measure with the DAX of a calculation item, based on selection in a helper table (and using TREATAS to transfer the filter context).

In the first example, a dummy measure [Blank] is used as a stand-in for measure replacement with Calculation Groups. In the second example, an empty string unicode character is used to replace (Blank) in KPI cards. The specificity rating here is strongly “it depends”, but since we are talking about report applications here, it’s typically visual field-specific.
Visual ‘MacGuyver’ measures are a “catch-all” to include all the measures used to twist the behavior of a visual to obtain a desired result not possible in normal circumstances. For example, you can dynamically calculate whether sales of a product are in the “vital few” or “others” categories in a Pareto analysis, then show one or the other in two measures. Placing both measures in a stacked bar chart lets you format the vital few a different color from the others, while allowing the pareto analysis to remain dynamic.

Alternate labels are done to abbreviate existing dimensions or include prefix/suffixes which are only appropriate for the specific report or visual. A simple example might be prefixing categories with a number to force a custom alphabetic sort order.

In the example, a calculated column is used to abbreviate the Area. This can be done in the source, in Power Query or in a DAX calculated column. Often, it’s done to make more concise labels, or to achieve a custom sorting with prefixes.
Some columns added to the data source contain URLs used for either images or navigation. These URLs can be used in some visuals like Tables or Matrixes to render the images or place links on text.

In the example an image is displayed in the table. This particular report is one I use personally to manage my Dungeons & Dragons campaign… A common use-case here is to display images of products or logos of companies & brands. SVGs are also images, of course.
Disconnected tables are very common, typically used when a ‘disconnected’ selection is required to drive an outcome in the report. For example, you can create a disconnected table to let the user select whether they want to see the ‘Period-to-date’ or ‘Full Period’ target, conditionally returning a different result depending on the user’s selection.

In the example, a disconnected table is used to drive the selection of a different measure depending on the filter context. This can be used to achieve measures as dimensions, like with the Waterfall chart.
Field parameters let users dynamically select dimensions or measures to be used in a visual. While they are the most easy and efficient way to get dynamic measure/dimension selection, these objects do not work in other client tools than Power BI Desktop.

In the example a field parameter is used to let the user select the dimension they want to slice the actuals by. They get full control of how the data is visualized and broken down. Field parameters are tool-specific because the tables contain annotations that prevent them being used in other client tools like Excel or Tableau.
Dynamic format strings let you display data in a different way for certain conditions. They can be used to add string prefixes or suffixes to data labels, or just have smarter rounding when using units like thousands (K) or millions (M).

In the example, a dynamic format string for this visual adds a prefix to label what it is. The ‘MTD’ label is added to the actuals, and ‘EOM’ is added to the label for the end-of-month target. There are also empty space unicode characters used to offset the x position of the MTD label.
Calculation groups have a number of model and report-specific functions. One small example of a report-specific function of calculation groups is measure-selection; allowing the users to dynamically select the measure used in a report (alternative to field parameters)

In the example, a user can switch both the actual and target. All numbers in the report will update based on their selection. For an overview of measure selection methods see this article.
Measure-driven data labels let you replace the ‘default’ labels of a visual with a different measure evaluating in the same context. This can be useful if you want to display the % achievement, but plot the raw values of a measure, among a wide range of other use-cases.
Today it is possible to perform MDDL with dynamic format strings. Perhaps in the future it may be possible in an easier way.

In the example the actuals are plotted against the target, but the percentage achievement is shown against both the Target and Flash Pool MTD.
Note: This is not possible in Power BI today. For a full visual wishlist (Oct 2022) see this article.
In the future it is likely that we will be able to use measures to conditionally format not only color but also fonts. This would allow us to hypothetically determine font type, size, and shape (bold, italic, etc).

In the example the axes and data labels are conditionally formatted both by color and font (strength; bold).
Context-dependent aggregations require a specific filter context to produce a result that makes sense. For example, taking the average sales for the days in a selection. These measures need to be authored such that they can’t produce unexpected results if the required filter context is empty.

In the example the “Flash Pool” measure will only produce a logical result if sliced by “Workdays MTD” on future dates of the current month. This measure estimates the projected revenue for the rest of the period based on expected revenue and a proportional uncertainty.
II. READ-ONLY VS. BUILD DATASETS
Power BI is more than a data visualization tool, and a Power BI dataset is used for more than serving visualizations. Datasets provide a logical layer to answer business data questions in different ways. This is important to keep in mind. As data professionals, our goal should be to create sustainable solutions that remain valuable over time, despite changes in requirements and context. Maybe your dataset only serves your centrally managed reports today, but will that always be the case? Will users connect to it to build their own content?
Datasets are generally used in three different ways in Power BI.
Read-only datasets centrally serve one or more reports, and are not accessible for end-users to make their own content, unless the personalize visuals feature is enabled on a Power BI report.
Build datasets centrally serve many reports, ad-hoc analyses, or even composite (proxy) models. End-users that have build permissions connect to the dataset from client tools like Power BI Desktop or Excel to perform ad hoc analyses or create and share their own content.
A niche dataset is created for a unique purpose, like the Personal BI usage scenario, rapid prototyping or task automation. A niche dataset is not accessed by end-users except maybe temporarily to test or demonstrate something; it is not designed for end-user reporting, and is outside the scope of this article.
CHALLENGES OF REPORT-SPECIFIC OBJECTS IN ALL DATASETS
In both read and build-only dataset scenarios, report-specific objects present challenges for dataset developers.

They clutter the model
These objects can quickly become prevalent, filling the model. If not well-organized, the model fields become difficult to navigate; it will be hard to find the right object to use or change.They make it harder to write DAX
These objects appear in intellisense, even if they are hidden. They can be confused with other generic objects, resulting in mistakes.They are hard to document and maintain
Since the object is created for a specific scenario, that context must be included in documentation. If undocumented, it isn’t possible to understand a report-specific object with the model, alone. Further, uncommon techniques may be used to make the objects, like creating SVG Measures for microvisualizations. This makes these objects inherently difficult to maintain for a new developer.
If left unchecked, these issues can lead to longer development times and higher risks of mistakes.
CHALLENGES OF REPORT-SPECIFIC OBJECTS IN BUILD DATASETS
Report-specific objects in build datasets can hurt end-user Power BI adoption. Users with build permissions that try to use these objects may get unexpected results or errors. This will waste their time, or may result in users becoming frustrated, or worse, making wrong conclusions from the data.
Below are examples of situations that will lead to issues with report-specific objects in build datasets.

Produce incorrect or confusing results
Any report-specific objects require the exact context for which they were designed; if users are not instructed on how to use these objects, the result will not be as expected.Hiding them doesn’t prevent them from being used
Build users connecting from Power BI Desktop can still view hidden objects. Even if the report-specific objects are marked “invisible” by the developer, they can still easily be viewed, and cause just as much confusion.Don’t work in all client tools
Not all Power BI dataset objects work in all client tools. Field parameters, for example, function only in Power BI Desktop, producing errors in Analyze-in-Excel or Tableau. Even if end users are instructed on how to use them, they get different results depending on the tool they use.
If left unchecked, these issues will hurt user trust in Power BI and centrally-served datasets.
HOW TO ADDRESS THIS PROBLEM?
Developers must be able to isolate report-specific objects from the rest of the model. Otherwise, there is always a risk of the report-specific objects being used in the wrong context, producing wrong results. There are some possible solutions, though each have their own caveats:

It is possible to create and use measures in “thin” reports. This is one way to isolate report-specific measures from the model, but it is still not an ideal approach. Governing these measures is painful due to the lack of tools and visibility, and it risks de-centralizing logic. Further, this would only work for measures, and not other model objects. You can’t use external tools or supported programmatic methods to manage these measures.
Ensure that the data type of report measures are set appropriately to be able to use them in conditional formatting. In the below example, the report measure doesn’t work because the data type is set to “Decimal number” automatically (Thanks to Twan Verdonschot for pointing this out).
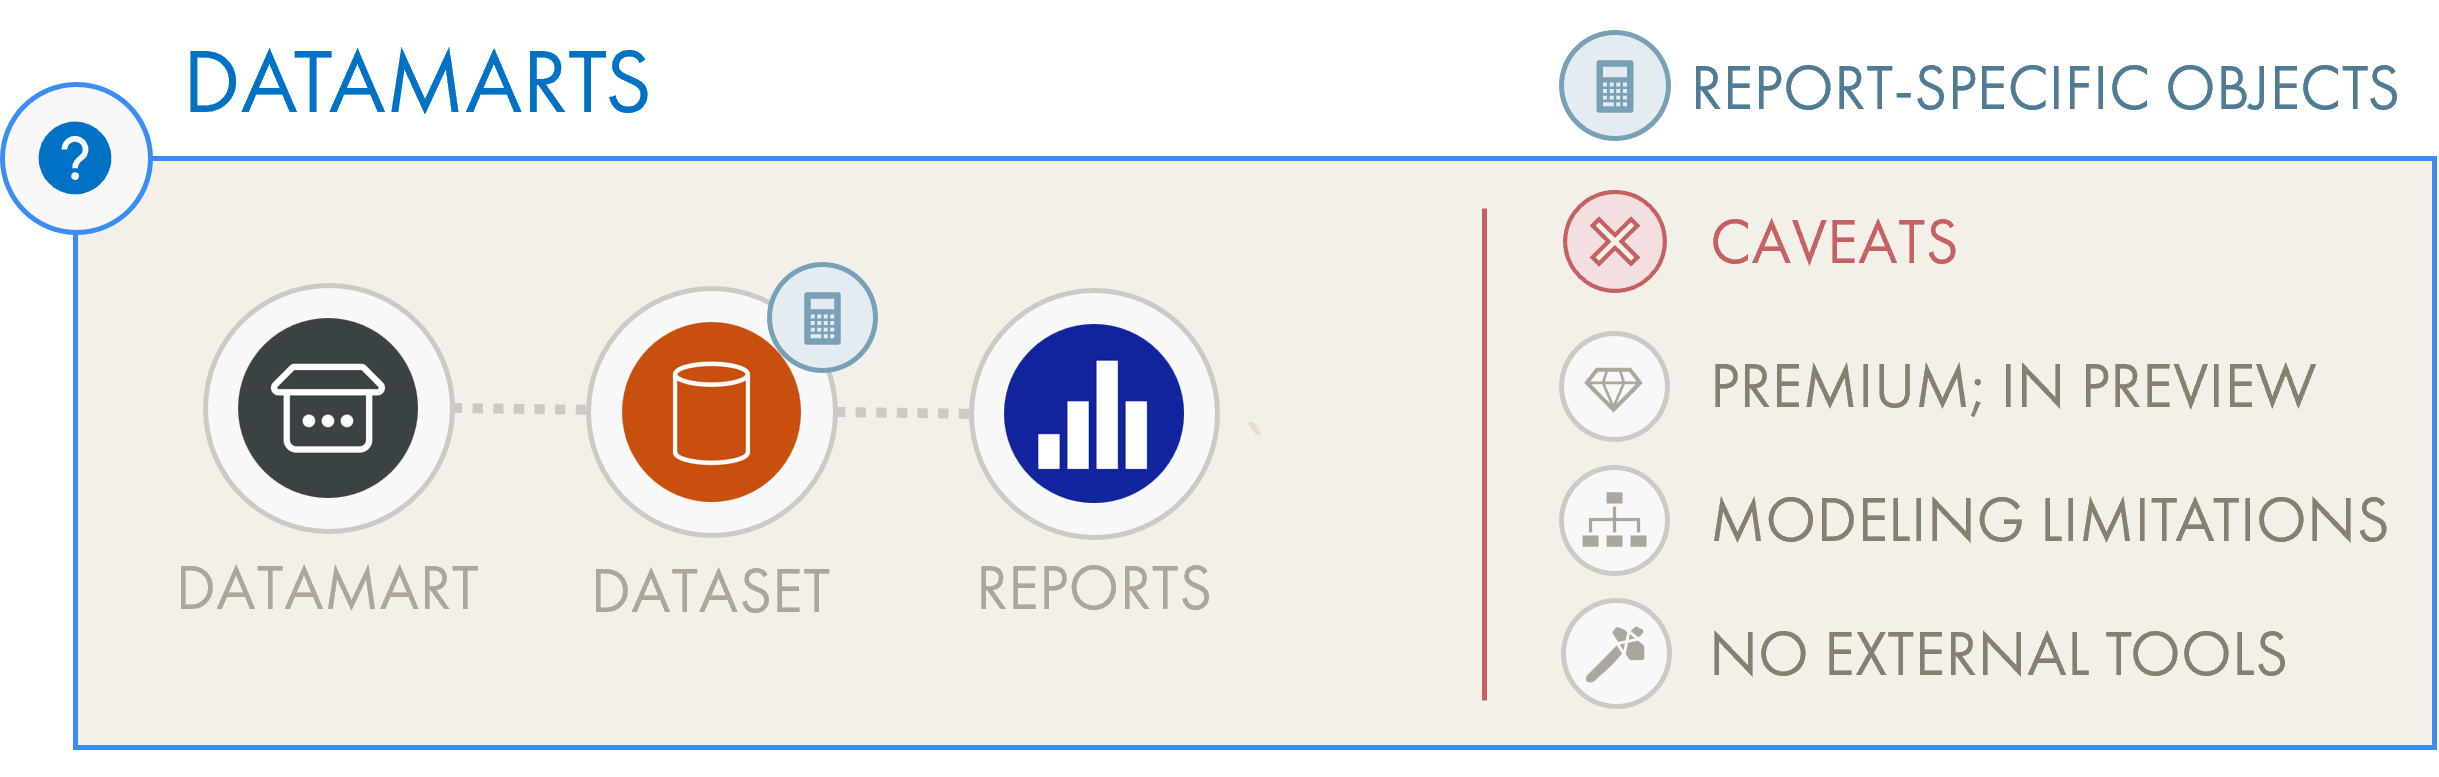
A preview feature released in Q4 2022, Power BI Datamarts allow limited modeling and measure authorship. Theoretically, it could be possible to have the semantic model in the upstream datamart, while the reporting layer is the downstream Power BI dataset. Datamarts are a Premium feature. Further, it isn’t possible to model the data from external tools and a number of considerations and limitations make it likely that this solution will introduce excessive complexity

A third possibility to separate the model and reporting layer is with multiple Power BI datasets. With this approach, a first model contains the semantic data model layer. Then, a second, composite model connects via direct query to this first dataset. Report-specific objects are then added in this reporting layer. Build users would connect to the first dataset — the semantic model — away from the report-specific objects
While this approach works in theory, in practice it is likely to be byzantine; overly complex and probable for you to have extra overhead to manage and support. Composite models create additional complexity with particular approaches, for example using ALLSELECTED, calculation groups and data security permissions. They have a long list of considerations and limitations. If you have sufficient understanding of composite models and how to implement them in your architecture, you may want to consider this approach for a true isolation of the semantic model and reporting layer. This must be carefully critically appraised, however, to prevent an increase rather than a decrease in solution complexity.
The last point is there are some careful governance considerations that must be made. While a composite model cannot change the model it’s connected to, it can alter the definitions of measures taken for itself. To put it another way, a composite model can change the definition of the base model measure [Sales] so that it instead evaluates to only “1”. This can only be done with external tools, and the details are beyond the scope of this article. The point is that the fact that this is possible creates possible scenarios where the underlying model cannot preserve it’s single truth across a chain.
So what should we do? How can we get more flexible, effective visuals with report-specific objects without negatively impacting other users and developers?
III. BETTER MANAGEMENT OF REPORT-SPECIFIC OBJECTS
In both read-only and build datasets, report-specific objects should be segregated from the model. However, until a Power BI tool or feature supports this, developers will have to do it themselves with disciplined practices and good model hygiene. In short, this requires uniquely identifying, isolating, and preventing end-users from querying report-specific objects, where possible. Further, they require careful documentation both with detailed in-line comments and object descriptions. Doing this will make the model easier to use and prevent errors, improving the experience for both developers and users connecting to the model.
1. DEFINE YOUR MODEL USAGE SCENARIO: READ-ONLY OR BUILD?
Every developer must know the usage scenario of the data models they are working with.
Do users have read-only or build permissions?
What proportion of users have build permissions?
Who all has write permissions; should they?
It’s essential to understand how your dataset is being used. This ensures that you can take the appropriate steps to ensure the model works in all supported scenarios. Don’t assume that just because your model is a read-only, single-developer model today, this will always be the case. The future for your dataset will be a very different place from the present…
2. IDENTIFY REPORT-SPECIFIC OBJECTS IN THE MODEL
It’s important to be able to easily identify report-specific objects in the dataset. You should do this using one of the below object properties:

A. Name: Give report-specific object names a unique prefix or suffix. This can also help you identify and filter them in intellisense.
B. Description: Create a specific description that uniquely identifies report-specific objects. Descriptions are an easy, standard way to document model objects.
C. Annotations: Annotations let you give descriptive attributes to objects, but are not accessible from Power BI Desktop. Using Tabular Editor, you can add an annotation ReportSpecific with a value “1” to the object.
3. ISOLATING REPORT-SPECIFIC OBJECTS FROM THE REST OF THE MODEL
To ensure an organized and usable model, report-specific objects should be isolated in the model. Below are the different ways that you can do this:

A. Use a report-specific measure table: Place report-specific measures in their own measure table. This is a static table made in DAX or Power Query, which has a single, hidden column. You can move measures to this table by changing the property Home table in the Power BI model view, or dragging and dropping the measure in Tabular Editor. Doing this is a simple way to segregate report-specific measures from the rest of the model. It also enables better options to hide them (discussed in #4).

B. Use display folders in your model: Organize your model using nested display folders with a consistent structure. You can do this from the model pane in Power BI Desktop, but it’s much easier from Tabular Editor. Ensure your display folder structure is consistent and folder names are concise. This is considered a good practice to make your model easier to use and maintain.

C. If you use Tabular Editor, use Table Groups: In Tabular Editor 3, it’s possible to place table objects into display folder-like groups. This lets you create separate groups for calculation groups, disconnected tables and field parameters. This does not carry to Power BI Desktop; it only benefits other developers and yourself.
4. RESTRICT VISIBILITY & QUERYING BY USERS WITH BUILD PERMISSIONS
Any objects that are not intended for user consumption should be hidden in the broadest sense possible. There are different approaches to do this, outlined below:

A. Mark report-specific objects as Hidden: This is the bare-minimum that all developers must do to hide report-specific objects. This will not prevent hidden objects from appearing in intellisense when writing DAX. However, they can still be viewed from Power BI Desktop if end-users right-click the fields pane and select “view hidden”.

“Private” is a table property that also affects all columns and measures in that table. It can be used to “super-hide” these objects without preventing evaluation.
B. Mark report-specific objects as Private: The property Private appears for tables, and is only visible from external tools like Tabular Editor. This property is like “super-hidden”. If you set the Private property to True, then the table and all child objects like columns and measures…
will not be visible in client tools: The objects won’t appear in the field pane, irrespective of whether the user selects ‘view hidden’ or not. They are still visible from within Tabular Editor.
will not appear in intellisense: When using intellisense, the objects don’t appear as suggestions.
will still evaluate normally if used in DAX: All of the objects still evaluate normally; they can be used. They just won’t be visible outside of an external tool.
Note that for calculation groups, this can only be done with C# scripting using a short script of Selected.Table.IsPrivate = True.
Note also that this property will not be visible if using Tabular Editor as a Power BI Desktop external tool, unless you enable unsupported features in Tools > Properties.
C. (Optional - test before implementing) Set Available In MDX to False: This property prevents a column from being evaluated in MDX. It only has an effect for client tools using MDX, like Analyze-in-Excel. It should be carefully tested before being implemented.
D. (Optional - test before implementing) Use Data Security to restrict objects: Consider design of data security to hide objects or options for roles that have build permissions. How to do this is outside the scope of this article, but see this article for a summary of RLS & OLS. This should be carefully tested before being implemented.
5. DOCUMENT REPORT-SPECIFIC OBJECTS WITH COMMENTS & DESCRIPTIONS

Since report-specific objects are created for a particular context, it’s not possible to understand them with the model, alone. It’s important to describe the purpose of the object in its description, together with concise explanations using in-line comments in both DAX and Power Query code.
Be careful to not rely on generative AI like ChatGPT for this step, as they also lack the context to give meaningful descriptions or comments.

TO CONCLUDE
Report-specific objects are created in the data model to support specific visual requirements. They are necessary to design good reports, and are supported by Microsoft to do so. However, they live in the data model, which serves more than visualizations. Report-specific objects can confuse both other developers and end-users using the model to make their own content. When evaluated outside the right context, they produce strange or incorrect results.
To address this problem, it’s insufficient to only hide report-specific objects, or worse, to say it’s not necessary, since you are the only developer and have no build users, today. Report-specific objects must be isolated in the model, documented, and even made Private by modifying the table TOM properties. In some situations, you may even consider complete segregation of the semantic model from the reporting layer using composite models, though this must be carefully considered so as to not create extra overhead and complexity.
IV. KEY TAKEAWAYS
Report-specific objects are model objects created to support specific reporting requirements.
They are designed for a specific use-case and context
They provide flexibility in report visuals and are expected, supported features in Power BI
Evaluating these objects outside the context for which they were designed can produce unexpected or erroneous results, hurting the experience for end-users
Datasets can be described by usage scenario: read-only, build or niche datasets.
Read-only datasets serve reports; users do not have access to the data model
Build datasets serve reports, but some users connect to the dataset to make their own
Report-specific objects impact developers of both datasets, but are particularly dangerous when left unhandled for consumers of build datasets
Report-specific objects warrant special attention to mitigate impact on self-service users
Define clearly if your dataset is a read-only or build dataset
Identify and label all report-specific objects in your model (name, description or annotation)
Isolate report-specific objects in separate tables and folders
Hide report-specific objects, preferably by setting the table property Private to True
Document well the intended result and purpose of all report-specific model objects
Special thanks to:
Reid Havens (Reid’s YouTube)
for reviewing this article!

