Check & Query Data from Tabular Editor
QUERY YOUR MODEL FROM TABULAR EDITOR
…view data & test DAX while developing your Power BI Dataset
CHECK & TEST MODEL DATA
While developing your Power BI Dataset, you must routinely query the model with a table or visual to check data, your model design and your DAX code. In Power BI this is done in the visual canvas, but how is this done from Tabular Editor? Many developers will work on the Power BI dataset from Tabular Editor with a separate “thin” report open in Power BI Desktop to test & view recent changes. However, this can cost time & efficiency from alternating between two different windows and user interfaces. This becomes particularly problematic when searching transactional data in tables, as there’s no way in a Power BI Desktop “thin report” to see a “table data view”. Instead, you must tediously create a table visual on the canvas to give you what you need. Further, Power BI visuals can make it more difficult to test & debug initial DAX code due to modified filter context on the report page — if you forget a slicer, filter or interaction, for example.
Instead, you can use Tabular Editor for both developing and querying / testing the model. This gives immediate, explicit feedback so you can focus on development without wasting time on ad hoc testing & exploration. There are a number of ways to do this, and this article gives a brief overview of each.
This article focuses on Tabular Editor 3; any mention of ‘Tabular Editor’ refers to Tabular Editor 3. Note, however that it is also possible to use method 4 in Tabular Editor 2, discussed below.
| Approach | Description | Automatic Refresh | Test RLS with Impersonation [A] |
TE3 [B] |
TE2 |
|---|---|---|---|---|---|
| 1. DAX Query | Write & execute DAX queries; modify DAX measures within the query scope. | ✓ | ✓ | ✓ | ✗ |
| 2. Pivot Grid | Drag & drop fields in a formatted pivot table or filters to query the model via MDX. | ✓ | ✓ | ✓ | ✗ |
| 3. Preview Data | View & filter table transactional data in a quick & efficient preview window. | ✓ | ✓ | ✓ | ✗ |
| 4. Evaluate DAX in C# Scripts | Create context-sensitive C# Scripts & macros to evaluate DAX or model objects. | ✓ | ✗ | ✓ | ✓ |
[A] Impersonation requires that the user has build permissions on the dataset,
and is added to the appropriate security role via the Power BI Service.
[B] Connecting to a remote model requires a Business or Enterprise license.
DEVELOPING WITH DAX QUERIES
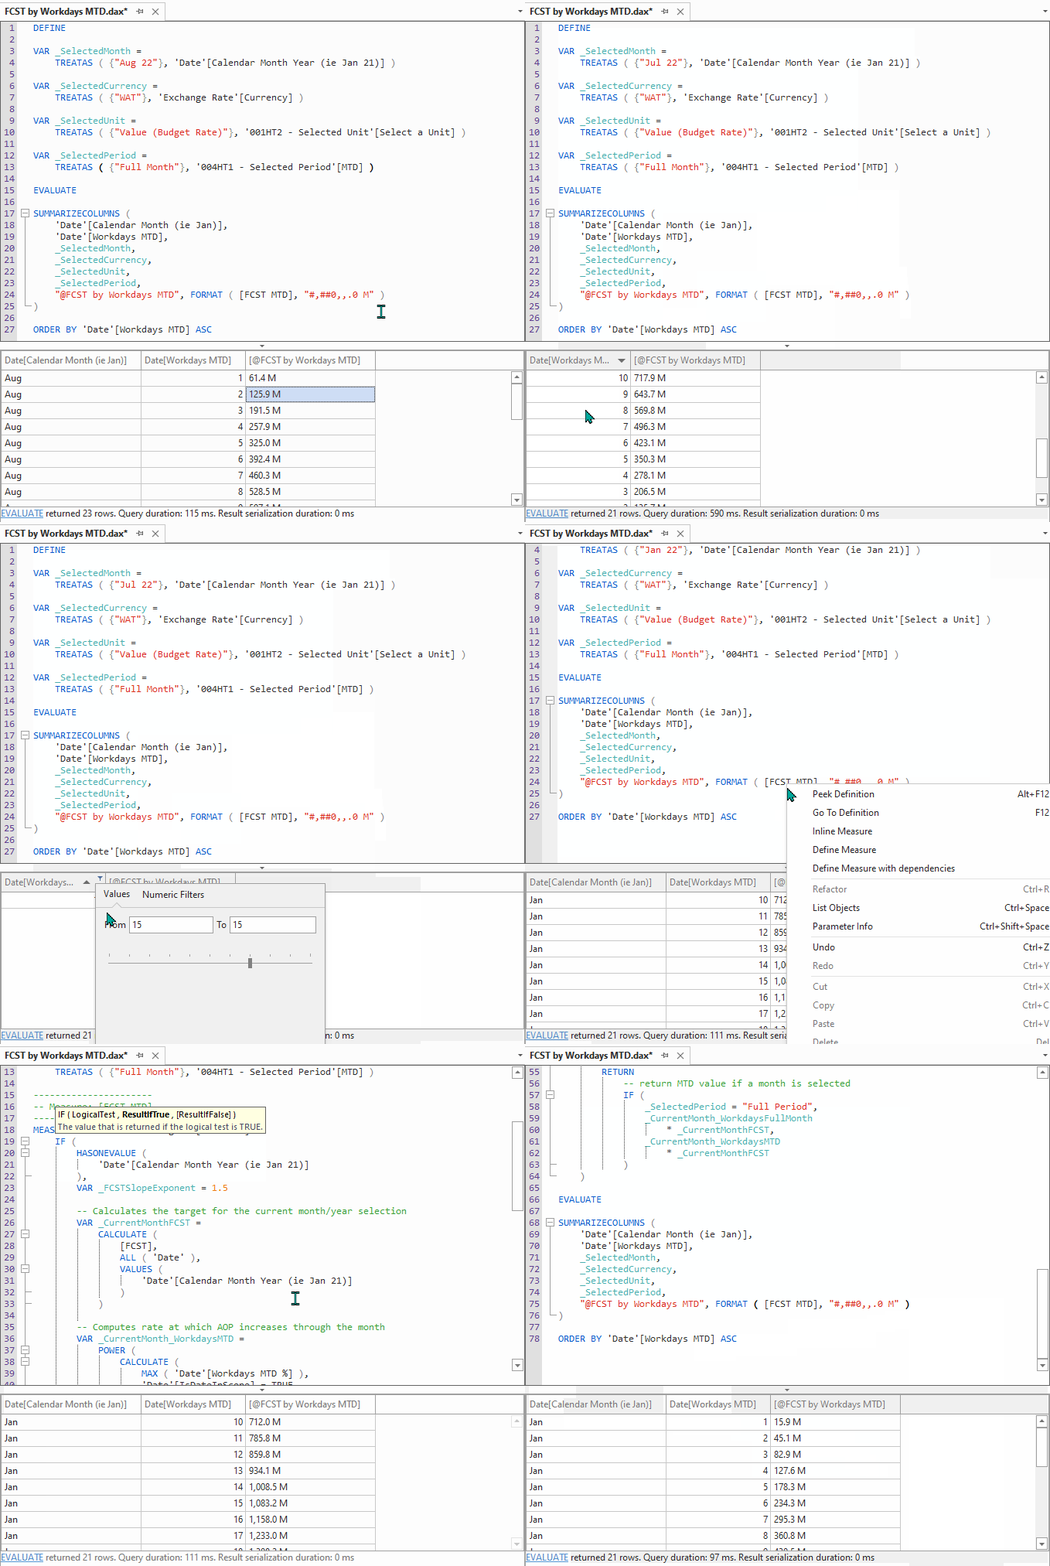
DAX queries are generated by Power BI visuals and other client tools to query the data in your model. They can also be authored & evaluated from the ‘DAX Query’ window in Tabular Editor 3. From here, you can use the DAX code-assist features and DAX Debugger to develop, test & debug your code. Query windows will automatically refresh when changes are deployed to the model, letting you focus on development while periodically checking query window results.
Developing in the DAX Query window becomes particularly helpful when using Define and In-line measure to declare and modify it’s DAX definition in the query scope. This allows you to safely make & test changes to a measure without changing the underlying measure DAX; the expression is only changed for that query. No changes are written to the model. When using a read-only instance of Tabular Editor connected to a production model, this lets you safely use production data to develop & test difficult DAX measures.
This lets you easily modify both the filter context and underlying DAX in a single, contained environment, which you can comment, save & document.
One of the biggest boosts to the productivity & quality of my DAX development was authoring & testing more complex DAX from within the query window with Define Measure:
Reduced time between iterations: A single window for all development, testing & optimization.
More flexibility: Modify the query, filter context, measure DAX & upstream dependencies.
Better documentation & repeatability: Save query & results in source control for later use.
Dive deeper with the DAX Debugger: Once changes are written, SUMMARIZECOLUMNS queries with measures can be interrogated to break down each step in the evaluation and understand the details of how the query reaches the final result.
If you aren’t quite comfortable writing your own queries, you can also copy Power BI visual queries using the “Performance Analyzer” in Power BI Desktop, adjusting and executing them in the Tabular Editor DAX Query window. The performance analyzer & how to copy queries are described in this article by SQLBI.
USING A DRAG & DROP, PIVOT-TABLE-LIKE EXPERIENCE
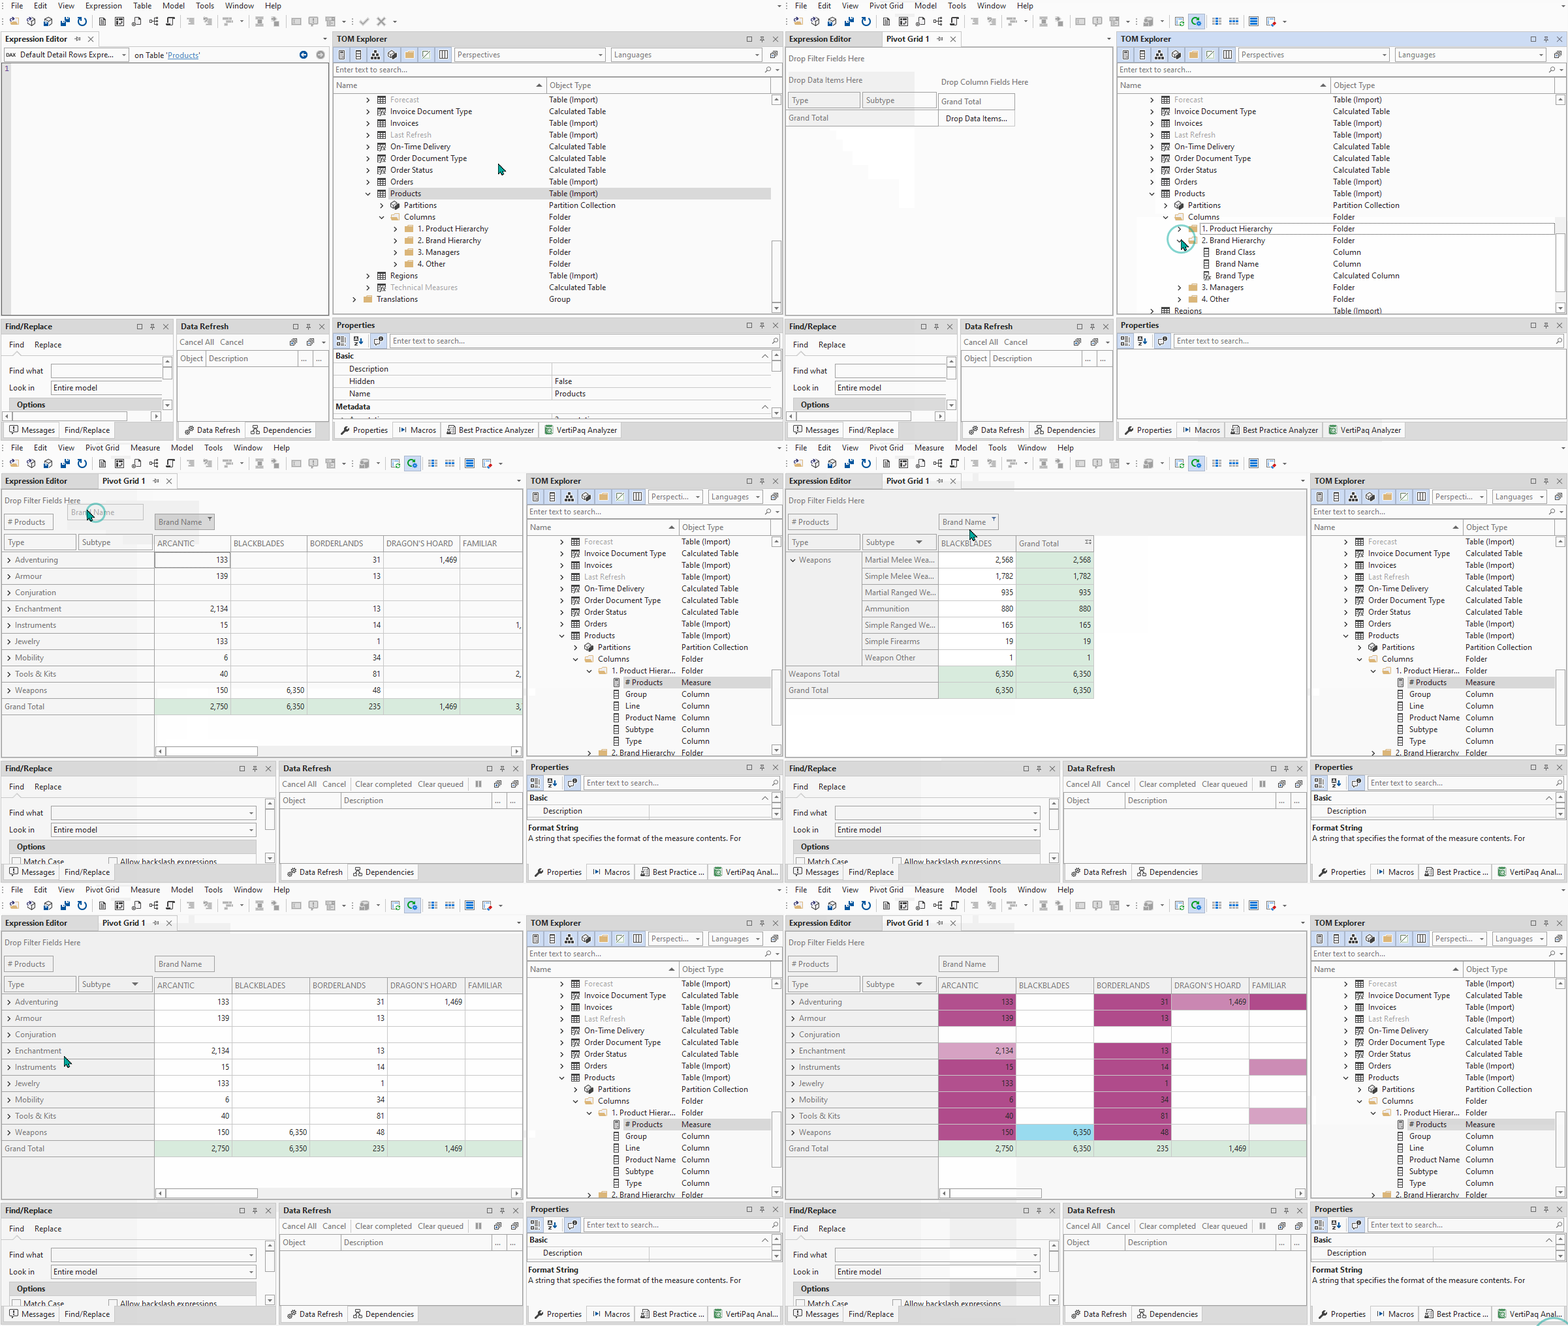
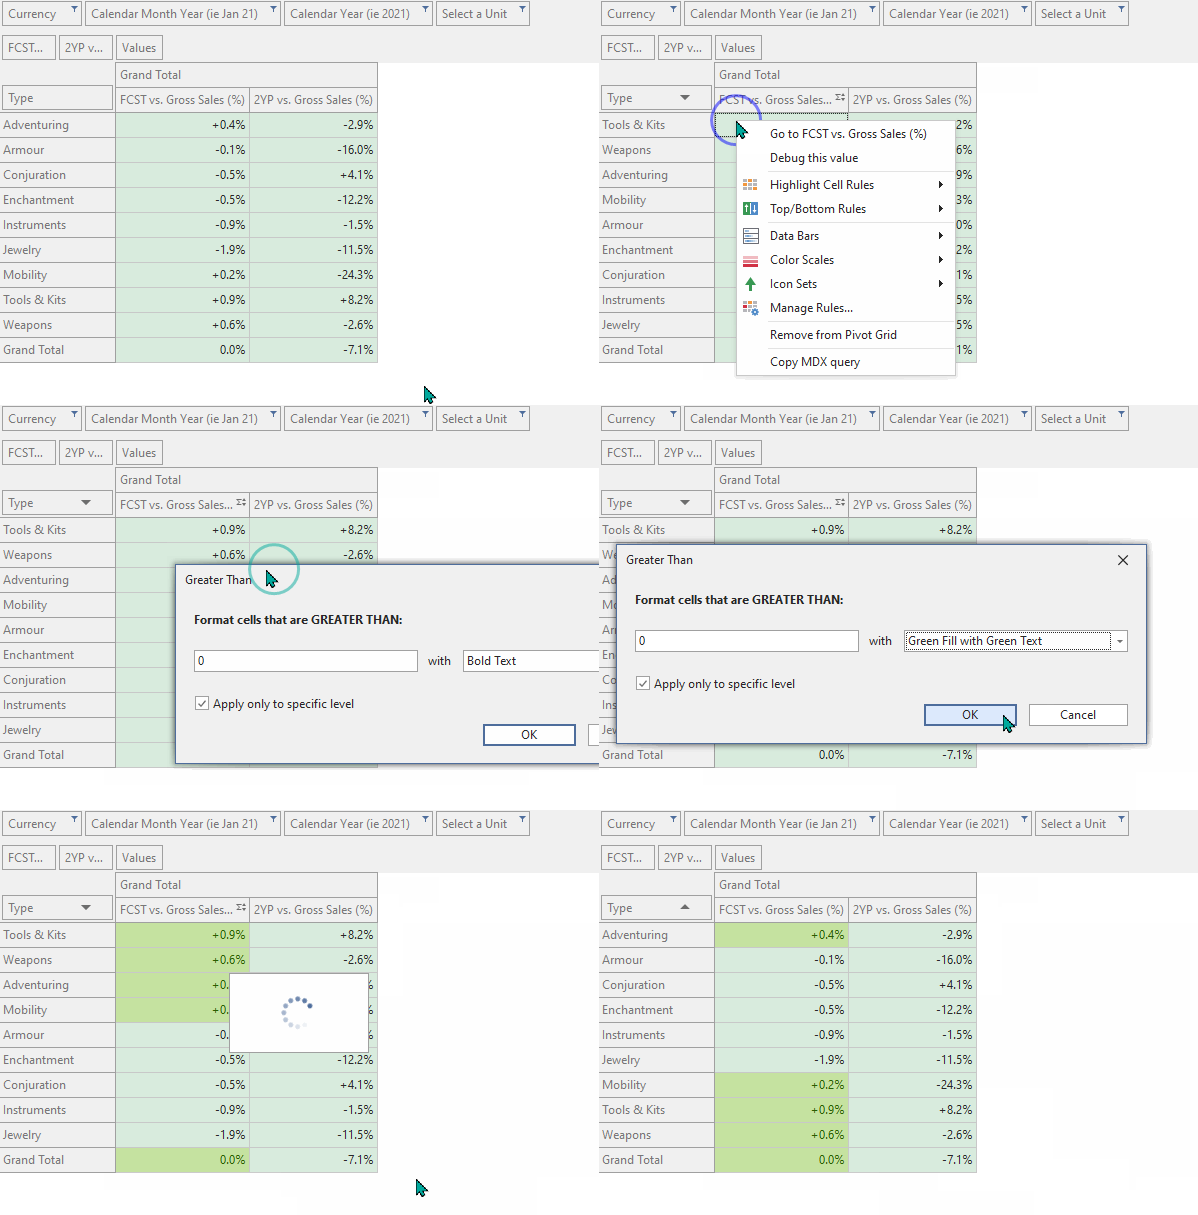
If you prefer not to write DAX queries or you want to perform simpler checks, you can also drag & drop fields and measures into the Pivot Grid window. This will generate an MDX query to produce a pivot-table-like matrix, displaying the results. The Pivot Grid can be filtered and formatted, making it a nice tool to interrogate data and perform small, ad hoc investigations to i.e. find outliers or check how measures evaluate across different categories & breakdowns.
Any open Pivot Grid will automatically refresh when changes are deployed to the model from Tabular Editor, making it easy to test and check their result. Impersonation of roles and users works on Pivot Grids as well, allowing you to test RLS, so long as the user being impersonated has build permissions on the dataset and is added to the security role from the Power BI Service.
PREVIEW & FILTER TABLE DATA OR TRANSACTIONS
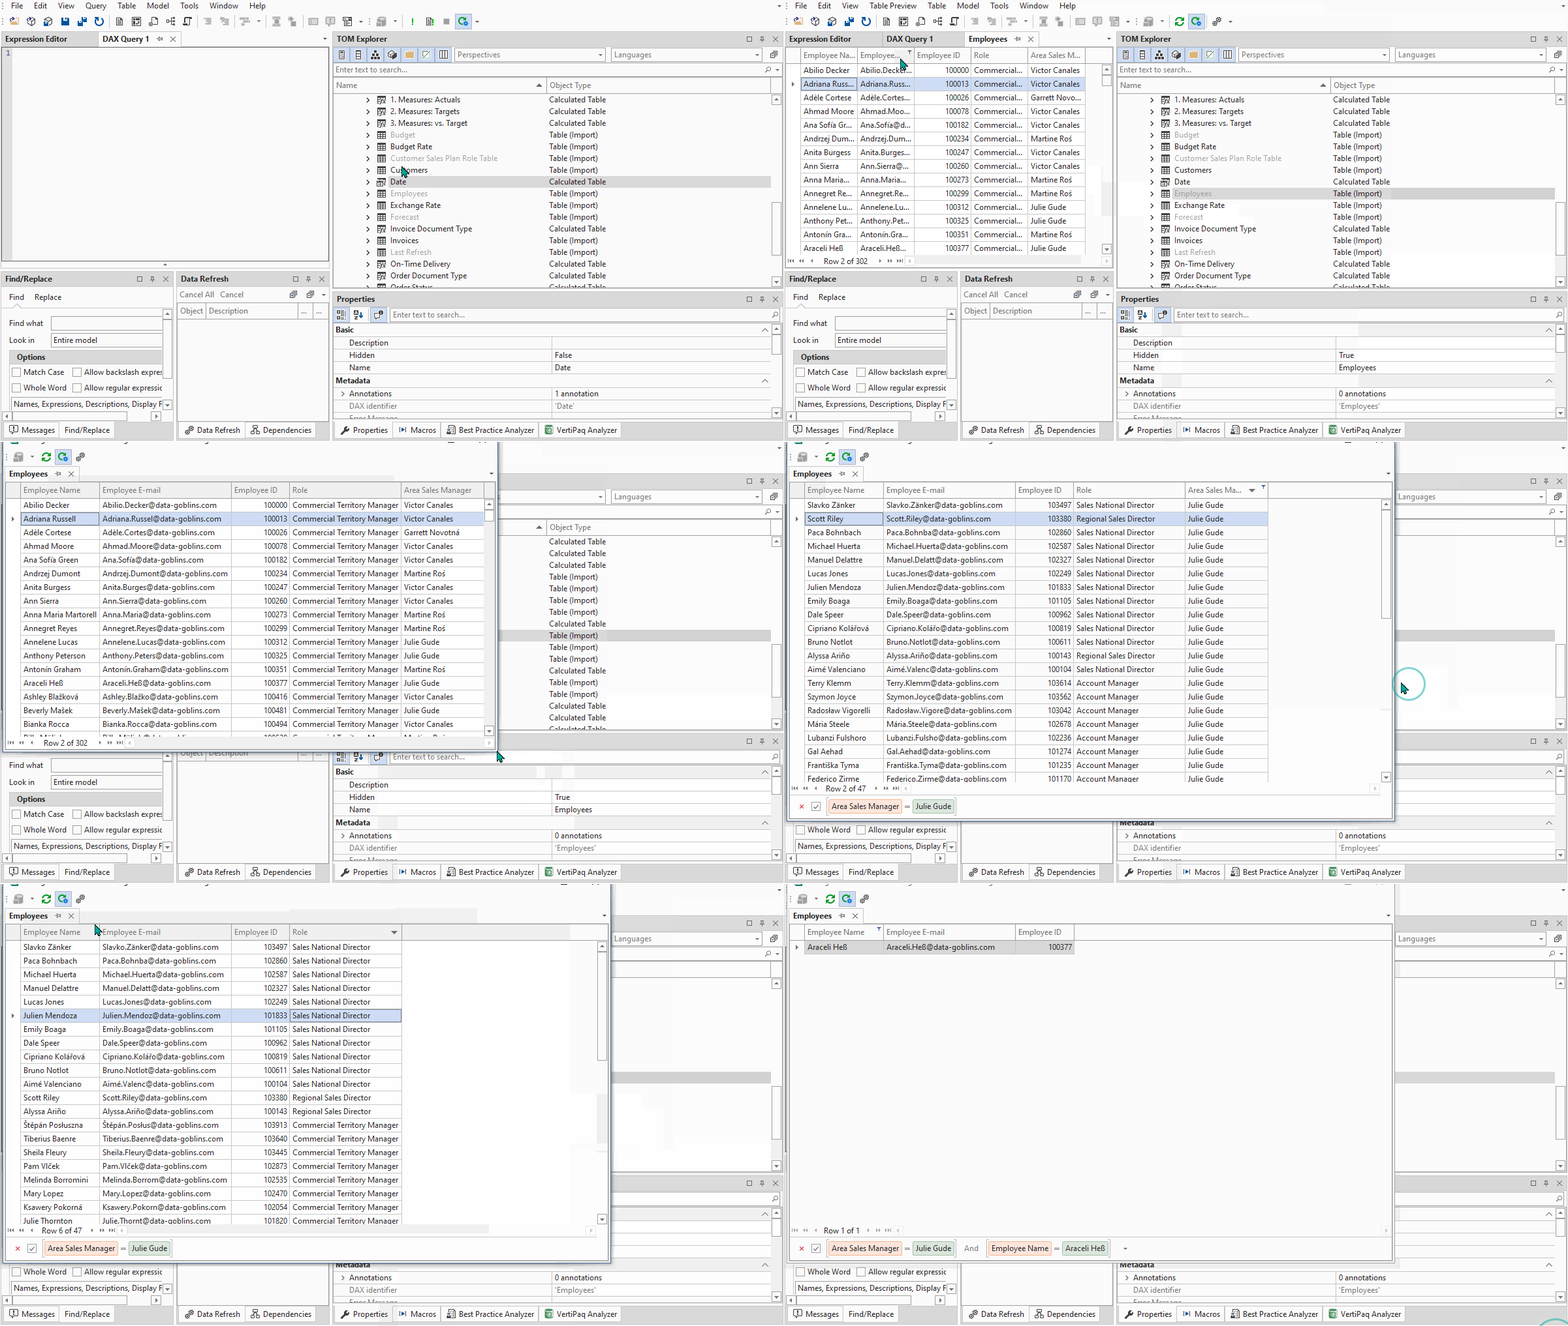
When developing the model, you often want to check table data or even individual transactions. This might be due to data quality issues or anomalies, or just to check and investigate dimension tables. In Tabular Editor you can right-click & select ‘Preview data’ for any table, which will show the top N rows for each column (usually 1000; configured from preferences). While open, columns can be filtered, rearranged or even dropped from the view.
Any active impersonation will also be reflected when Previewing data, making it easy to test & check RLS not only for specific queries, as above, but also for dimensions and transactions.
EVALUATE DAX FROM WITHIN C# SCRIPTS & MACROS IN TABULAR EDITOR
One of the most powerful features in Tabular Editor, C# scripts allow programmatic access to the Tabular Model Metadata. We can use them to read, interact with and write model metadata changes with some C# written inside the Tabular Editor “C# Script” window. One of the features of these scripts is it provides two different ways to evaluate DAX queries, which we can use in downstream elements & actions.
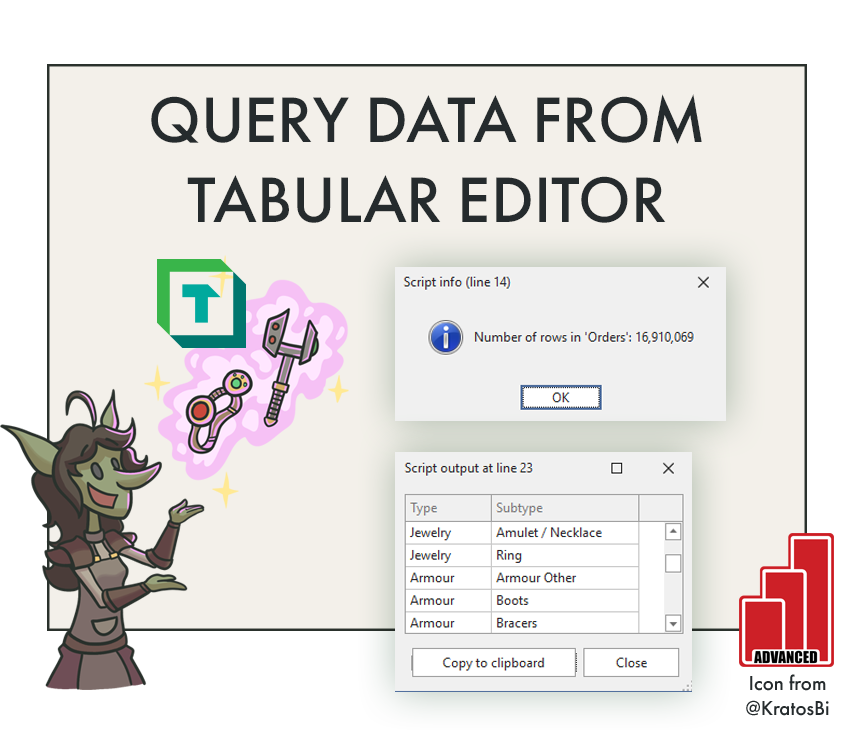
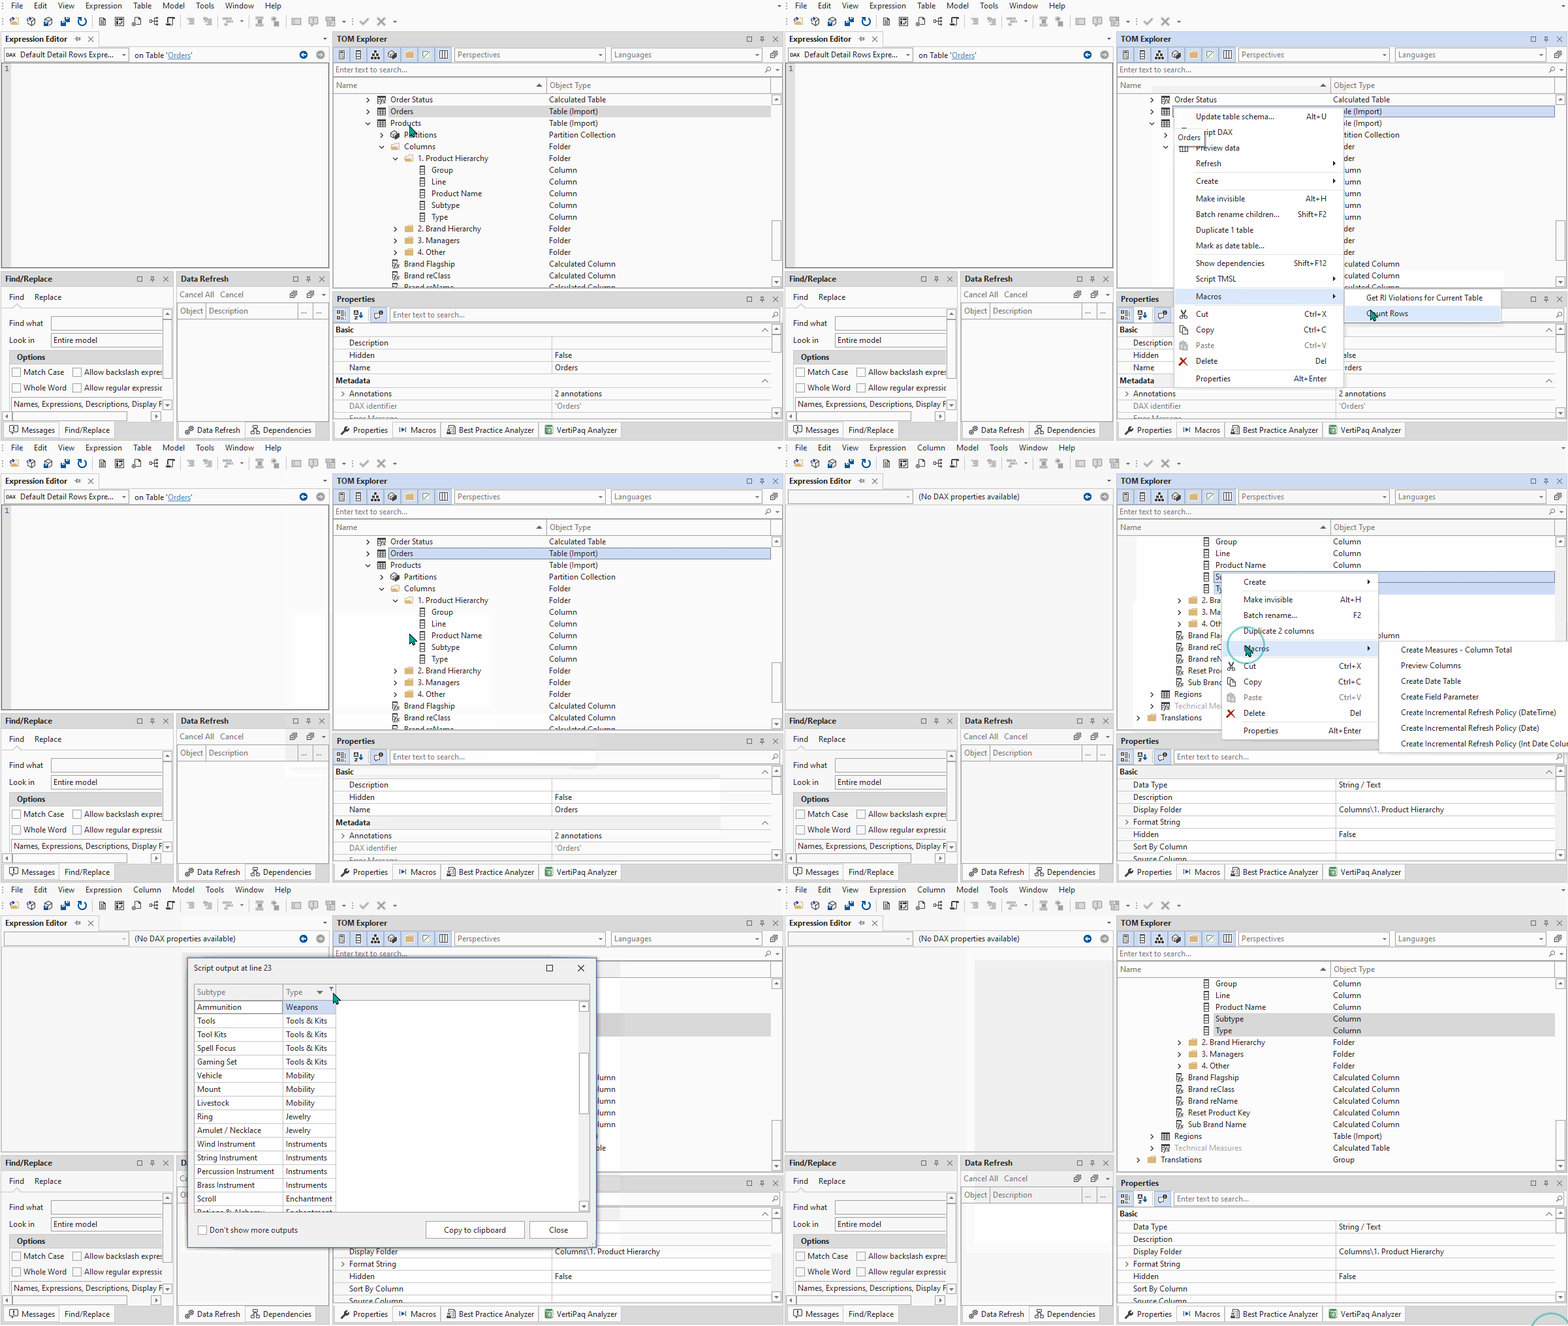
C# Scripts enable automation and extreme productivity enhancements. In this case, we can use scripts to evaluate selected objects in DAX queries and output the result in a pop-up table. This simple use-case can make it trivial to test & check our model while we work, particularly when combined with Tabular Editor’s custom keyboard shortcuts & hotkeys. The simplest example could be performing a row count of the selected table, while more complex examples evaluate selected columns or a selected measure to view the summarized result.
Like other use-cases, scripting is an advanced feature that enables automation and efficiency. Creating some scripts to test and check model objects can be very valuable during development. However, it’s likely that more specific, one-off queries will be used to cover the full scope of testing needed. Further, DAX queries evaluated in C# Scripts are not documented to respect any active impersonation, so testing of RLS will be limited to the other methods described, above (#1 - 3).
Regardless, creating some macros to execute & automate repetitious queries can be handy, save time & aid your development.
C# SCRIPT: PREVIEW COLUMNS / MEASURES
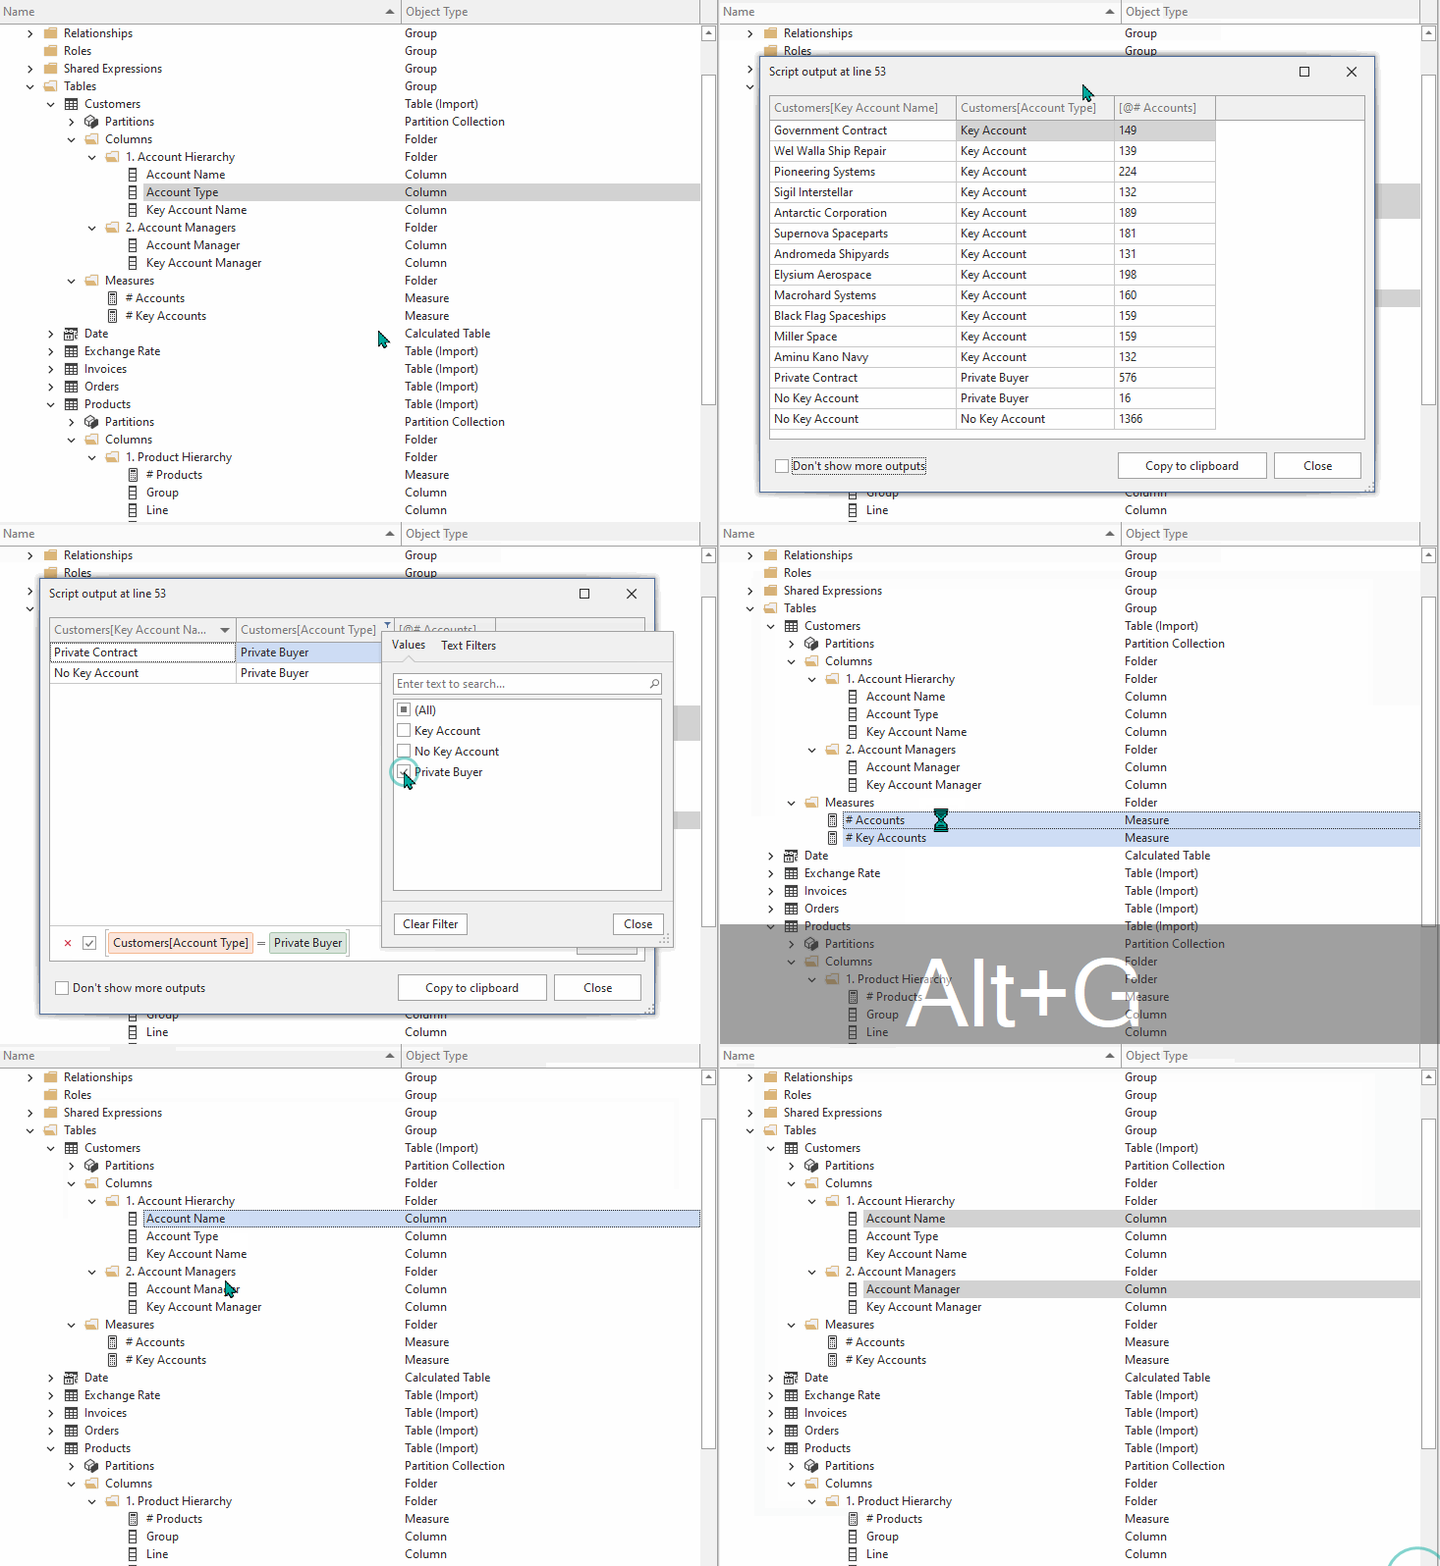
If the below script is copied into a Tabular Editor 3 C# Script window, you can save it as a macro and use it to query any valid combination of selected columns & measures in the model. The query result will be displayed in an interactive result window that can be sorted and filtered like any DAX query, or copied to the clipboard if you want to save the results. The script can also be modified to automatically generate logs and output files, if needed.
// Instructions
  // ------------
  // 1. Save this script as a macro with a context of 'Column' and 'Measure'
  // 2. Configure a keyboard shortcut for the macro (i.e. ALT + C) if using Tabular Editor 3
  // 3. Select any combination of columns & measures related in the model & run the script
  // 4. The output will return the evaluation result of all selected objects, assuming it is valid


  // Get column names
  var _ColumnsList = new List<string>();
  foreach ( var _SelectedColumn in Selected.Columns )
  {
      _ColumnsList.Add(_SelectedColumn.DaxObjectFullName);
  }
  string _Columns = String.Join(",", _ColumnsList );


  // Get measure names
  var _MeasuresList = new List<string>();
  var _MeasuresOnlyList = new List<string>();
  foreach ( var _SelectedMeasure in Selected.Measures )
  {
      // Create a syntax for evaluating objects when measures + columns are selected
      _MeasuresList.Add( @"""@" + _SelectedMeasure.Name + @"""" );
      _MeasuresList.Add(_SelectedMeasure.DaxObjectFullName);

      // Create a syntax for evaluating objects when only measures are selected
      _MeasuresOnlyList.Add(
          "\nADDCOLUMNS (\n{" +
          @"""" + _SelectedMeasure.Name + @"""" +
          "},\n" +
          @"""" + "Result" + @"""" +
          ",\n" +
          _SelectedMeasure.DaxObjectFullName + ")");
  }
  string _Measures = String.Join(",", _MeasuresList );


  // Results differ depending on how many columns, measures are selected
  int _NrMeasures = Selected.Measures.Count();
  int _NrColumns = Selected.Columns.Count();


  // ----------------------------------------------------------------------------------------//
  // Result if a combination of measures & columns are selected
  if ( _NrMeasures > 0 && _NrColumns > 0 )
  {
      // Summarize selected columns + measures with DAX
      string _dax =
          "SUMMARIZECOLUMNS ( " + _Columns + ", " + _Measures + ")";

      // Return output in pop-up
      EvaluateDax(_dax).Output();
  }


  // ----------------------------------------------------------------------------------------//
  // Result if no columns and more than 1 measure are selected
  else if ( _NrColumns == 0 && _NrMeasures > 1 )
  {
      // Evaluate each measure as a separate row
      string _dax =
          "SELECTCOLUMNS( UNION ( " +                    // SELECTCOLUMNS to re-name cols, UNION to combine rows
          String.Join(",", _MeasuresOnlyList ) + ")," +  // Concatenate list of measure evaluations
          @"""" + "Measure Name" + @"""" +               // Rename 1st col "Measure Name"
          ", [Value]," +                                 //
          @"""" + "Measure Result" + @"""" +             // Rename 2nd col "Measure Result"
          ", [Result])" ;                                //

      // Return output in pop-up
      EvaluateDax(_dax).Output();
  }


  // ----------------------------------------------------------------------------------------//
  // Result if no columns and exactly one measure are selected
  else if ( _NrColumns == 0 && _NrMeasures == 1 )
  {
      // Evaluate each measure as a separate row
      string _dax =
          "SELECTCOLUMNS( " +                           // SELECTCOLUMNS to re-name cols
          String.Join(",", _MeasuresOnlyList ) + "," +  // Concatenate list of measure evaluations
          @"""" + "Measure Name" + @"""" +              // Rename 1st col "Measure Name"
          ", [Value]," +                                //
          @"""" + "Measure Result" + @"""" +            // Rename 2nd col "Measure Result"
          ", [Result])" ;                               //

      // Return output in pop-up
      EvaluateDax(_dax).Output();
  }


  // ----------------------------------------------------------------------------------------//
  // Result if only columns and no measures are selected
  else
  {
      // Summarize selected columns with DAX
      string _dax =
          "SUMMARIZECOLUMNS ( " + _Columns + ")";

      // Return output in pop-up
      EvaluateDax(_dax).Output();
  }
Notes & Limitations:
- You must be connected to a processed data model (local .pbix or remote model in Power BI Premium / AS)
- To work you must select objects that can be evaluated together
- The script is provided as-is without warranty or guarantees. It has not been tested on Tabular Editor 2.
TO CONCLUDE
When developing your data model, you can test & check your developments by querying the dataset from Tabular Editor. There are four different methods to do this:
Writing DAX Queries
Drag & Drop Pivot Grids
Previewing Table Data
Evaluating DAX in C# Scripts & Macros,
like the one shared above
Using these methods will make development more convenient and efficient in Tabular Editor, streamlining your workflow and improving your experience testing & querying the model.


