Like-for-like comparison

The like-for-like sales comparison is an adjusted metric that compares two time periods, restricting the comparison to products or stores with the same characteristics. In this example, we use the like-for-like technique to compare the sales of Contoso stores that had sales in all the time periods considered. The stores are continuously updated: new stores are opened, other stores are closed or renovated. The like-for-like comparison only evaluates those stores that were open in all the periods considered. This way, the report does not show a store that seems to be underperforming simply because it was closed during the period analyzed.
As is the case with many other patterns, like-for-like can be computed statically or dynamically. The choice is both in terms of performance and in terms of business requirements. The variations of the “Same store sales” measure described in the following paragraphs are examples of like-for-like sales comparisons.
Introduction
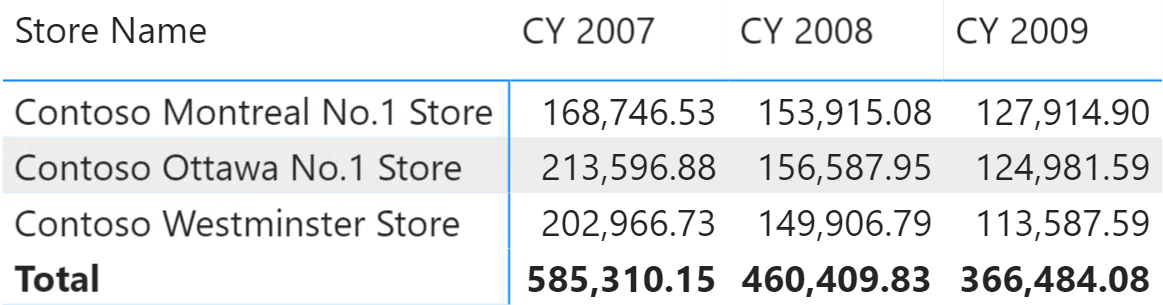
If you analyze sales figures without considering whether stores were open or closed within the time period you are analyzing, looking at the following report might mislead you into thinking that there were issues in 2009 because of the dramatic drop in sales.
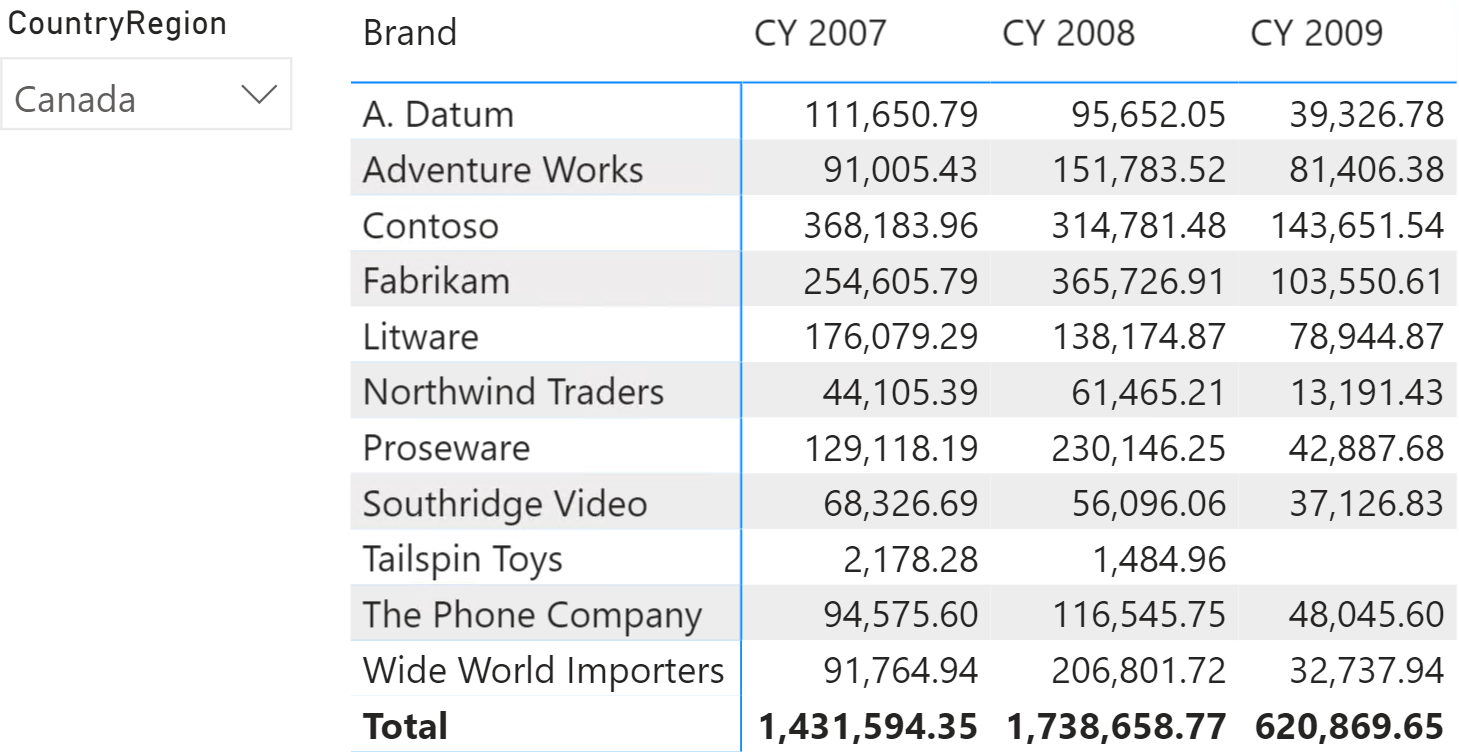
In 2009 many stores were closed. Therefore, the numbers reflect a substantial drop in sales due to the lower number of open stores, as you can see in the following report that shows which stores were open in different years. A blank cell means that the store was closed in that particular year.
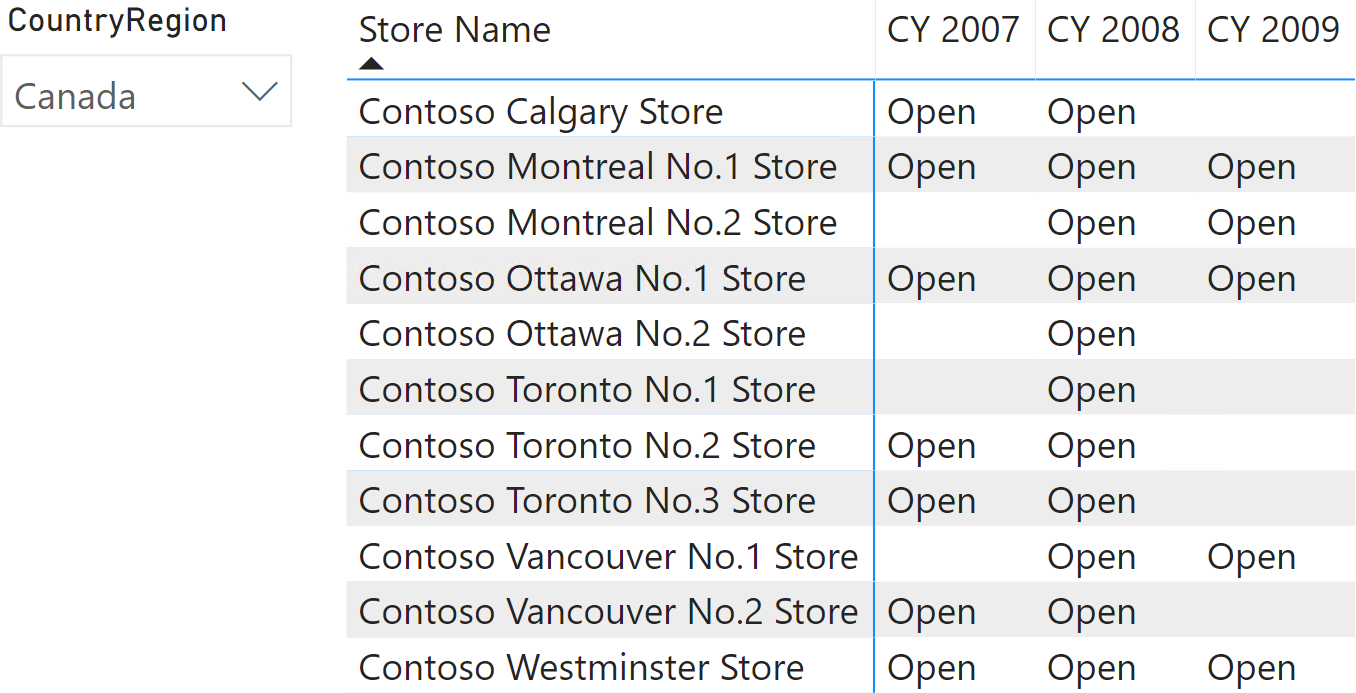
In the “same store sales” measure, you must compute the sales amount just for the stores that were open during the entire time period (2007-2009), namely three stores.

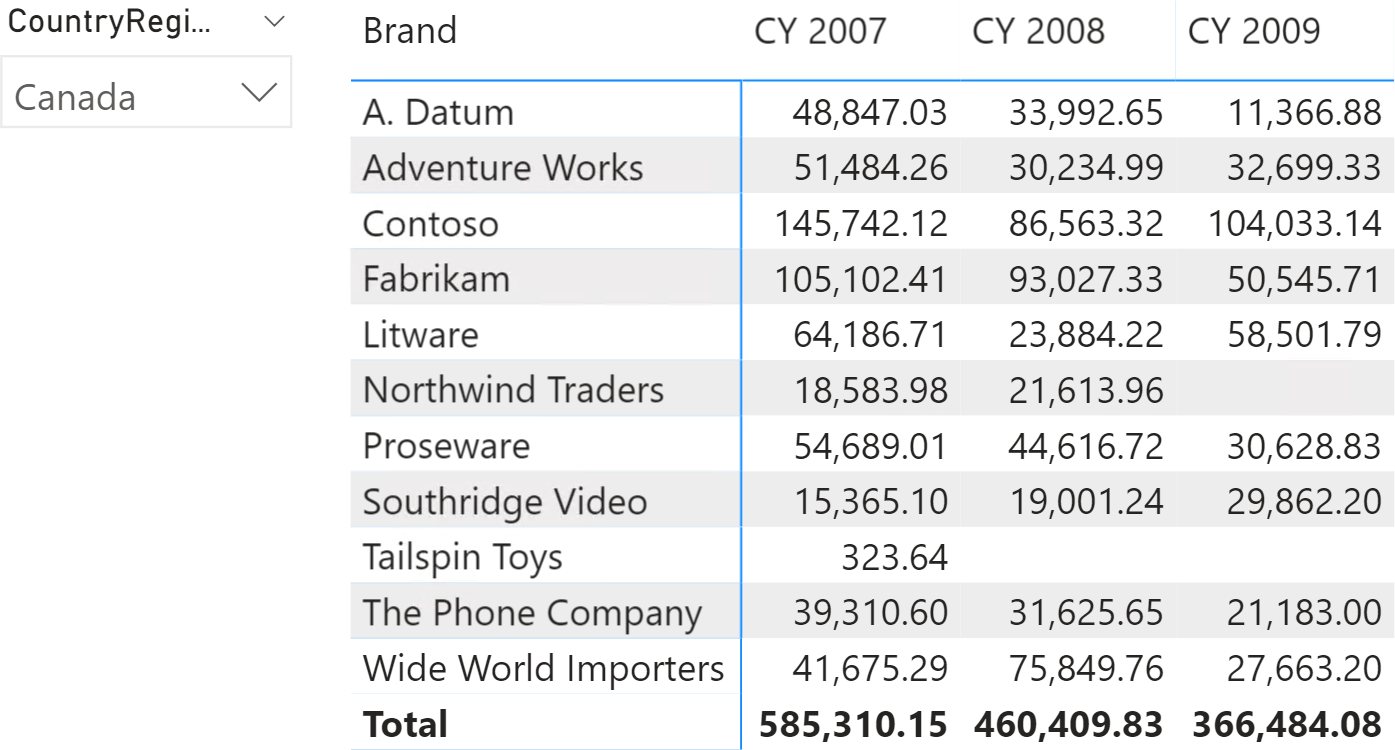
The measure must compute the correct value even when sliced by different attributes, as shown in Figure 4.
Same store sales with snapshot
The best method to solve the same store sales scenario is to use a snapshot table to manage store statuses. Later in this pattern we also demonstrate how to compute same store sales in a dynamic way without a snapshot table. Nevertheless, the snapshot table is the best option for both performance and manageability.
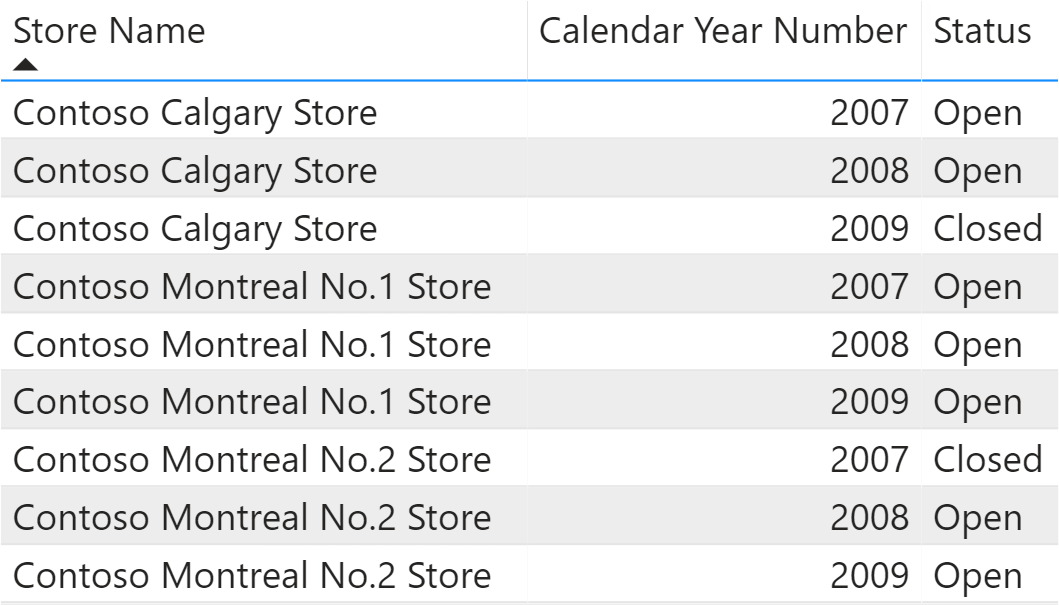
The snapshot table must contain all the stores and years, with an additional column indicating the status.
The StoreStatus snapshot table can be created with the following calculated table:
StoreStatus =
VAR AllStores =
    CROSSJOIN (
        FILTER (
            ALLNOBLANKROW ( 'Date'[Calendar Year Number] ),
            'Date'[Calendar Year Number] IN { 2007, 2008, 2009 }
        ),
        ALLNOBLANKROW ( Store[StoreKey] )
    )
VAR OpenStores =
    SUMMARIZE (
        Receipts,
        'Date'[Calendar Year Number],
        Receipts[StoreKey]
    )
VAR Result =
    UNION (
        ADDCOLUMNS ( OpenStores, "Status", "Open" ),
        ADDCOLUMNS ( EXCEPT ( AllStores, OpenStores ), "Status", "Closed" )
    )
RETURN
    Result
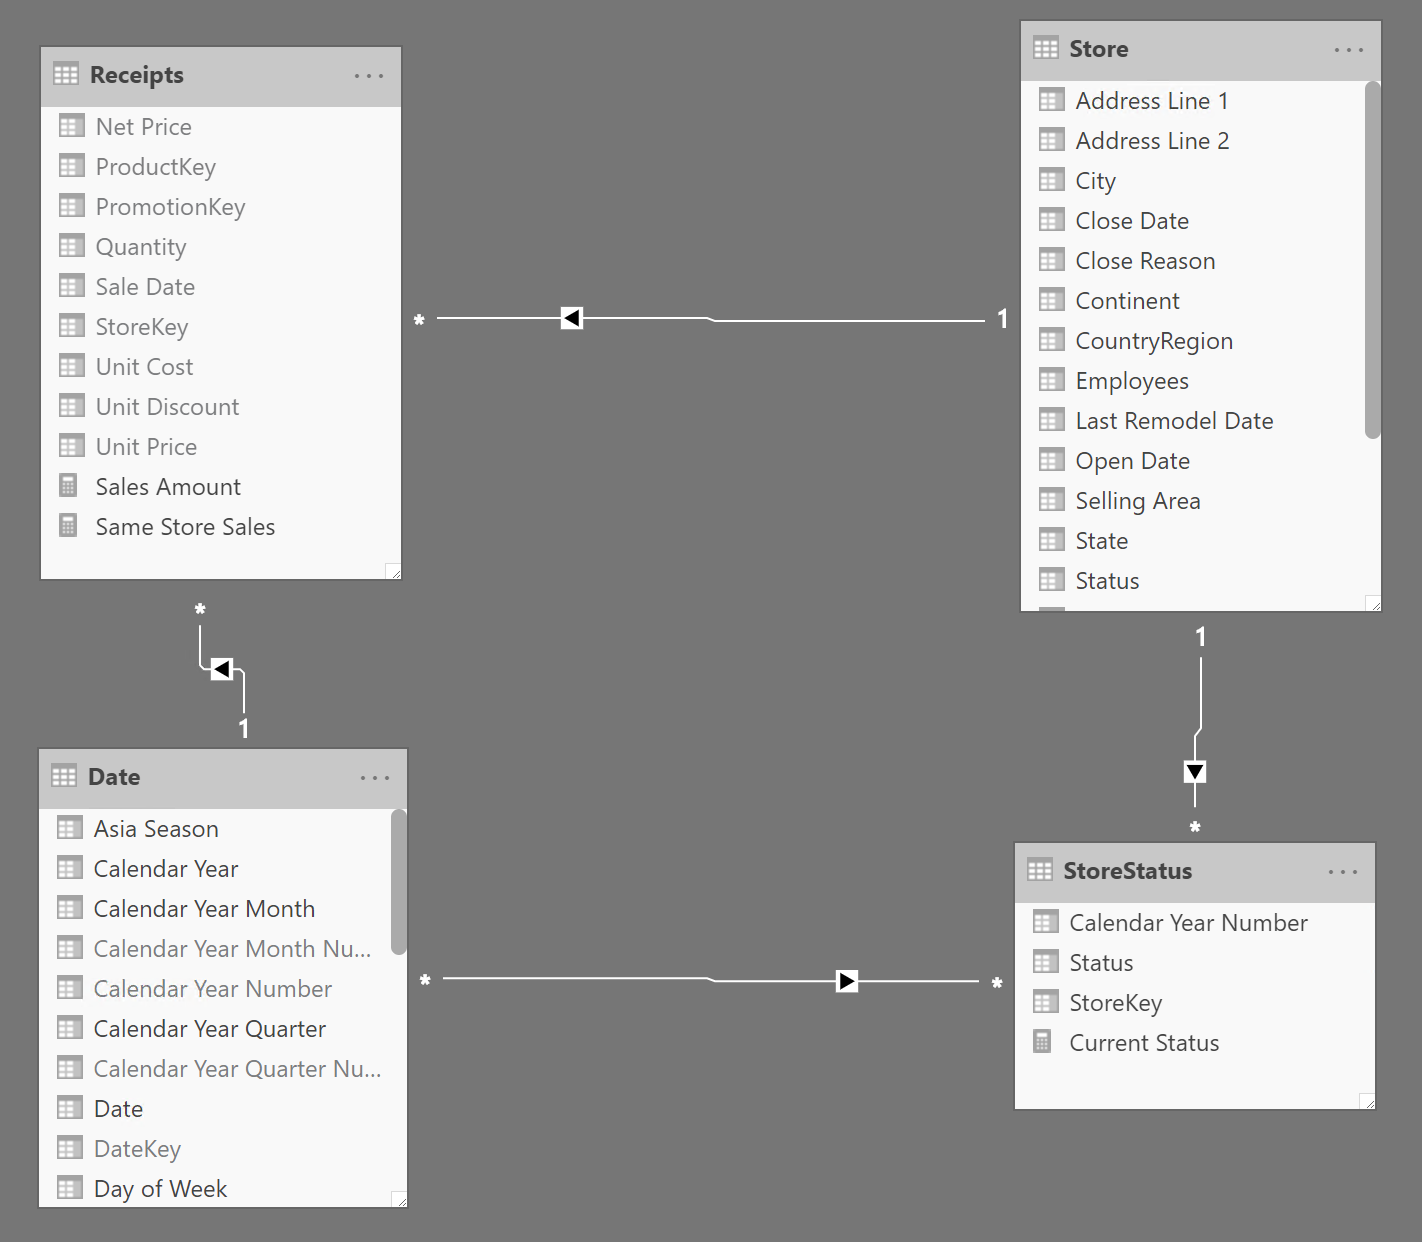
The StoreStatus snapshot table has a granularity by store and year. Therefore, it has a regular strong relationship with the Store table and a weak Many-Many-Relationship (MMR) with the Date table. If weak relationships are not available in your tool – like in Power Pivot – then you must transfer the filter from Date to Store in DAX using TREATAS or INTERSECT.
The Same Store Sales measure checks the stores whose status is always “Open” during the entire selected period. If a store is “Closed” at any point, then SELECTEDVALUE returns either blank or “Closed”, filtering out that store:
Same Store Sales :=
VAR OpenStores =
    CALCULATETABLE (
        FILTER (
            ALLSELECTED ( StoreStatus[StoreKey] ),      -- Filter the stores
            CALCULATE (                                 -- where the Status is
                SELECTEDVALUE ( StoreStatus[Status] )   -- always OPEN
            ) = "Open"                                  --
        ),                                              --
        ALLSELECTED ( 'Date' )                          -- Over all selected years
    )
VAR FilterOpenStores =
    TREATAS (                  -- Use OpenStores to filter
        OpenStores,            -- Store[StoreKey]
        Store[StoreKey]        -- by changing its data lineage
    )
VAR Result =
    CALCULATE (
        [Sales Amount],
        KEEPFILTERS ( FilterOpenStores )
    )
RETURN
    Result
The formula requires the snapshot table to contain the rows for all the years and stores. If you store in the snapshot table only the years when a store was open, then the code no longer works.
Same store sales without snapshot
In case you do not have the option of building a snapshot table, same store sales can be computed in a more dynamic way using only DAX code.
If the snapshot table is not available, then you must compute the number of years of the report dynamically, and then filter all the stores that have sales in all the years. In other words, if the report is showing three years, then only the stores that have sales in all three years should survive the filter. If a store does not have sales in any one of the selected years, then that store will not be considered for the calculation:
Same Store Sales Dynamic :=
VAR NumberOfYears =
     CALCULATE (
         DISTINCTCOUNT ( 'Date'[Calendar Year] ),
         CROSSFILTER ( Receipts[Sale Date], 'Date'[Date], BOTH ),
         ALLSELECTED ( )
     )
VAR StoresAndYears =
    CALCULATETABLE (
        SUMMARIZE (                    -- Group the Receipts table
            Receipts,                  -- by store and year
            Store[StoreKey],           -- in order to count how
            'Date'[Calendar Year]      -- many years a store is present in
        ),                             --
        ALLSELECTED ( )                -- Over all selected years and stores
    )
VAR StoresAndYearCount =
     GROUPBY (
         StoresAndYears,
         Store[StoreKey],
         "@Years", SUMX ( CURRENTGROUP (), 1 )
     )
VAR OpenStores =
    FILTER (
        StoresAndYearCount,
        [@Years] = NumberOfYears
    )
VAR Result =
    CALCULATE (
        [Sales Amount],
        KEEPFILTERS ( OpenStores )     -- Filters Store[StoreKey]
    )
RETURN
    Result
From a computation perspective, this formula is much more expensive than the one using the snapshot. Besides, the entire logic to determine whether a store is open or closed lies inside the formula. In our experience, such business logic is better handled outside of DAX, possibly stored in the data source. Therefore, if you do not have that information available in the data source we suggest the implementation using the snapshot – even for smaller data models.
The Same Store Sales Dynamic measure shows three stores that were open in Canada for the entire time period (2007-2009).
Treats the columns of the input table as columns from other tables.For each column, filters out any values that are not present in its respective output column.
TREATAS ( <Expression>, <ColumnName> [, <ColumnName> [, … ] ] )
Returns the rows of left-side table which appear in right-side table.
INTERSECT ( <LeftTable>, <RightTable> )
Returns the value when there’s only one value in the specified column, otherwise returns the alternate result.
SELECTEDVALUE ( <ColumnName> [, <AlternateResult>] )
This pattern is included in the book DAX Patterns, Second Edition.


Video

Do you prefer a video?
This pattern is also available in video format. Take a peek at the preview, then unlock access to the full-length video on SQLBI.com.Watch the full video — 17 min.
Downloads
Download the sample files for Power BI / Excel 2016-2019: