 Marco Russo & Alberto Ferrari
When you apply a filter in CALCULATE or CALCULATETABLE, by default the filter overwrites any existing filter over the columns specified in the filter. In order to avoid the overwrite of the existing filters, you can use KEEPFILTERS. This function changes the semantics of the filter applied to the filter context, to keep any existing filter over the same columns without applying an overwrite.
When CALCULATE is executed in a row context, it performs a context transition. The filter obtained by the context transition is always applied with the overwrite semantics. This is because there is no syntax for CALCULATE to specify KEEPFILTERS for the context transition. However, it is still possible to use KEEPFILTERS to change the semantics of the filter obtained by context transition but KEEPFILTERS must be there surrounding the iterator expression that generates the row context.
For example, the following expression specifies that the context transition executed by the Sales Amount measure will not overwrite any existing filter over the Customer[Name] column:
AVERAGEX (
    KEEPFILTERS ( VALUES ( Customer[Name] ) ),
    [Sales Amount]
)
That example is not a common use case. Most of the time, KEEPFILTERS is interesting when the iterator generates an arbitrarily shaped filter that must be preserved. For example, consider the following report.
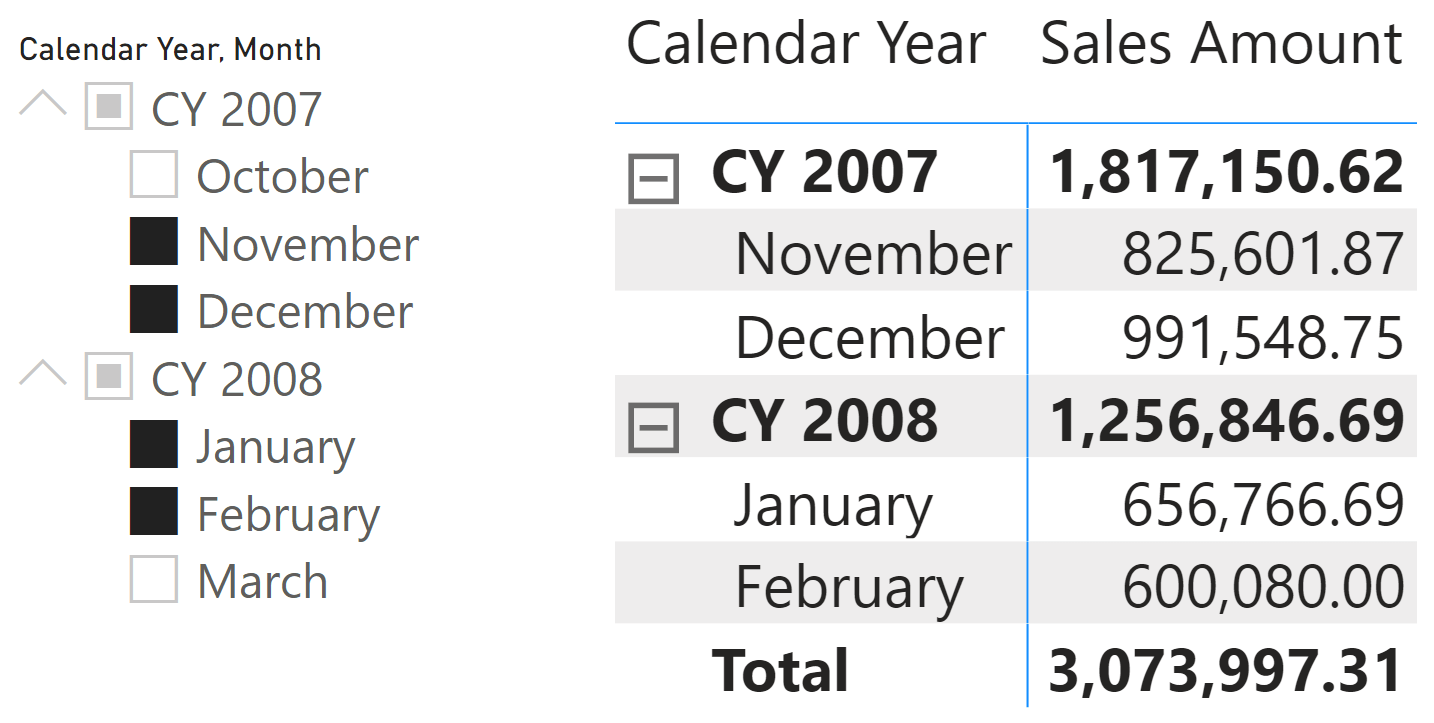
Through the slicer, the user selected two months in 2007 (November and December) and two months in 2008 (January and February). In this filter context, the matrix visual shows the four months, providing the right totals for Sales Amount. The filter defined by the slicer is called an arbitrarily shaped filter because it is not obtained using the intersection of all the combinations of the values visible in two or more columns. Indeed, the active combinations of Month and Calendar Year are the following:
| Month | Calendar Year |
| November | CY 2007 |
| December | CY 2007 |
| January | CY 2008 |
| February | CY 2008 |
We would have had a “regular” filter if we had all eight combinations possible by combining four months with two years.
For an additive measure like Sales Amount, the presence of an arbitrarily shaped filter does not create any problem, also because there are no context transitions involved in Sales Amount:
Sales Amount :=
SUMX (
    Sales,
    Sales[Quantity] * Sales[Net Price]
)
However, we can observe a very different behavior with the Monthly Average measure, which computes the average of Sales Amount by month:
Monthly Average :=
AVERAGEX (
    VALUES ( 'Date'[Month] ),
    [Sales Amount]
)
The iterator over the Date[Month] column retrieves the months active in the filter context and computes Sales Amount for every month. This is thanks to the context transition invoked by the measure reference, which involves an implicit CALCULATE. It could be surprising to look at the result of Monthly Average in the following report, where the Total row is clearly wrong.
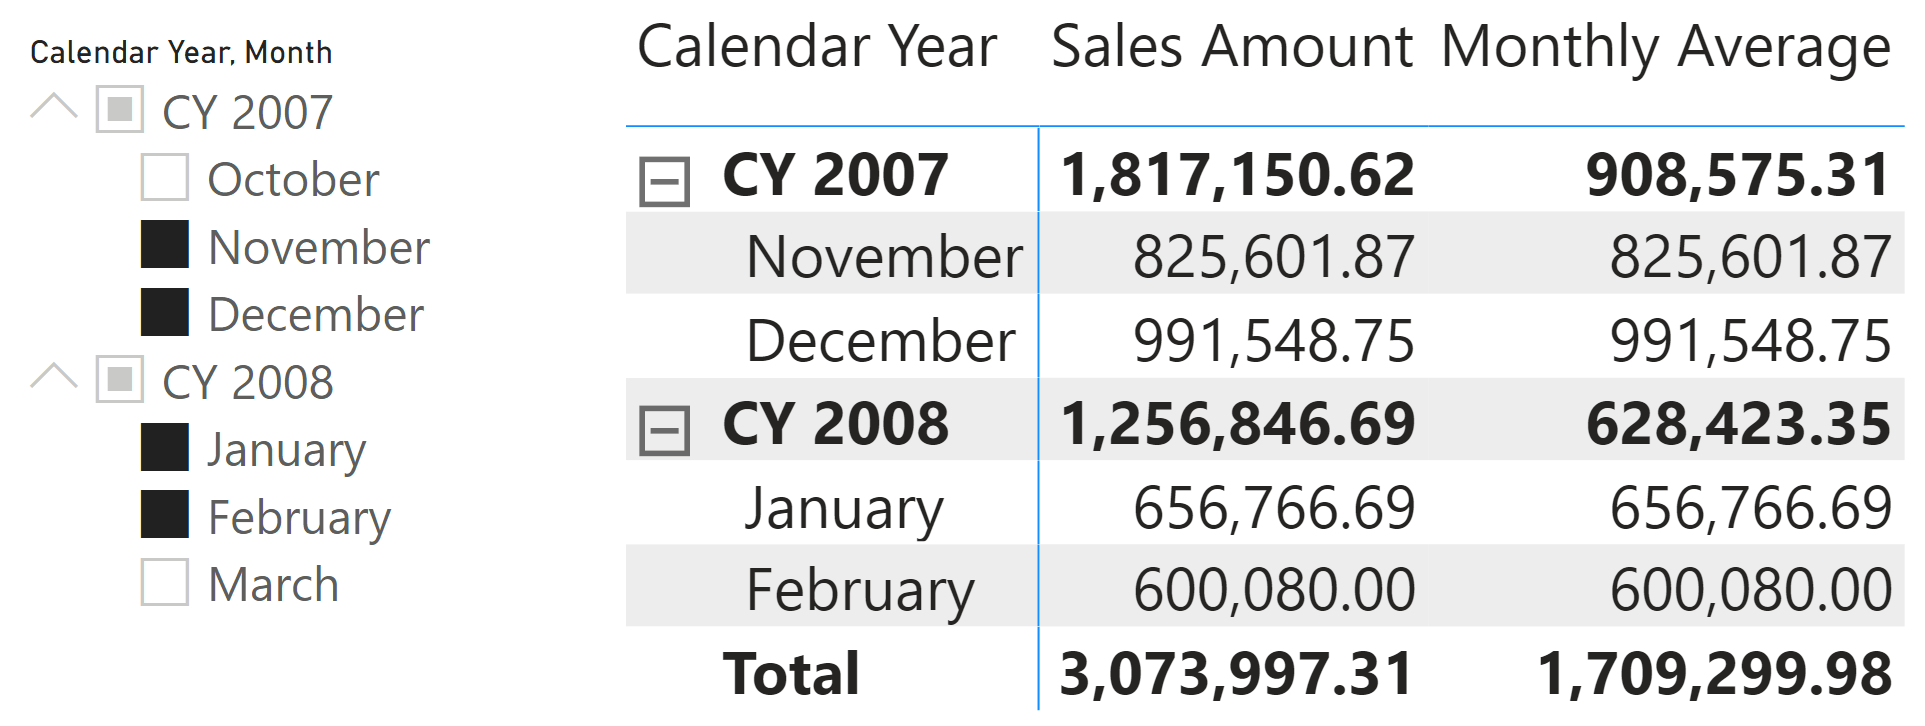
The Total of Monthly Average should be 768,499.33. However, it displays a very inaccurate number, higher than the value of any month displayed in the report. However, the subtotals at the year level and at the month level are correct. Why is this happening?
First of all, the measure was defined wrong. The Date[Month] column holds only 12 unique values (the month names), whereas the Date table contains data for 12 months in each year. Therefore, a better definition of Monthly Average should use the Calendar Year Month column; it shows “January 2007” or “January 2008” in a string, with different names for each month in each year:
Monthly Average :=
AVERAGEX (
    VALUES ( 'Date'[Calendar Year Month] ),
    [Sales Amount]
)
However, for educational purposes, we want to understand why the original Monthly Average measure returned that specific number.
For the Total row, the filter context contains 4 months. These are returned by the VALUES ( Date[Month] ) expression.
| Month |
| November |
| December |
| January |
| February |
For each month, the context transition applies one month as a filter in the filter context, which has the arbitrarily shaped filter with two columns: Date[Month] and Date[Calendar Year]. Because the filter applied only overwrites Date[Month], the values in Date[Calendar Year] are still in the filter context without the corresponding month. Therefore, the resulting filter context for the first month iterated (November) is the following.
| Month |
| November |
| Calendar Year |
| CY 2007 |
| CY 2008 |
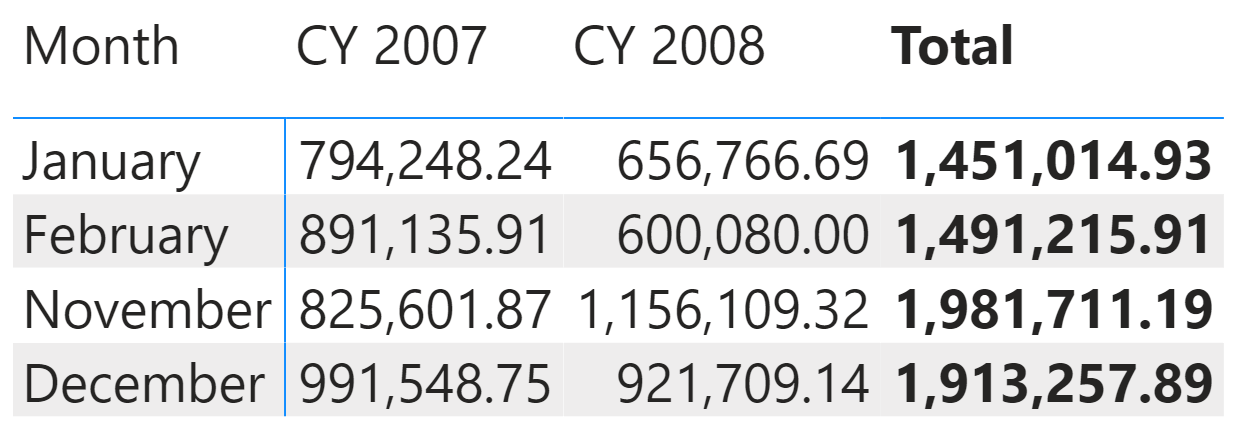
The filter context filters November for CY 2007 and CY 2008, including November 2008 that was not part of the initial filter context! The same happens for the other 3 months, which means that the AVERAGEX iterator performs the average of 4 months, each one aggregating two years (2007 and 2008). The result in the Total row is higher than any other value because it is the average of the Total value of the four months.
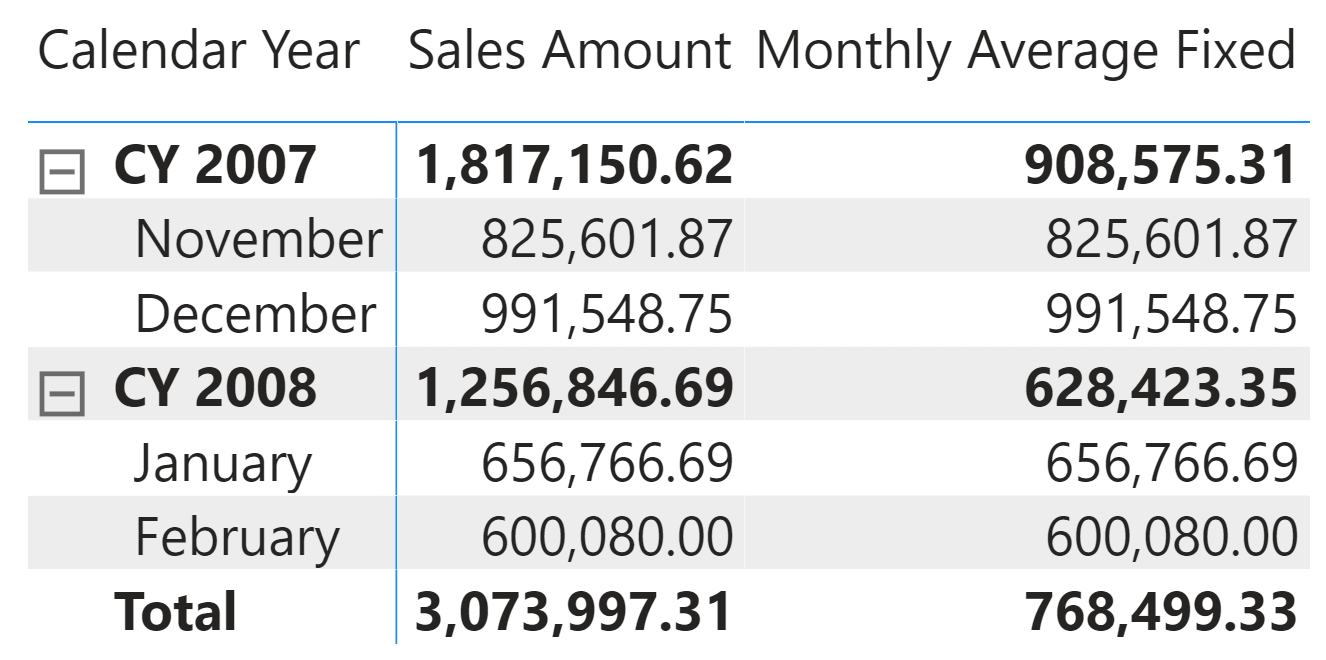
Thus, the context transition over a single column breaks the existing arbitrarily shaped filter context that includes the iterated column. In order to avoid this issue, we have to change the filter semantics of the context transition by applying KEEPFILTERS over the iterator:
Monthly Average Fixed :=
AVERAGEX (
    KEEPFILTERS ( VALUES ( 'Date'[Month] ) ),
    [Sales Amount]
)
By using the KEEPFILTERS function, each month iterated by AVERAGEX is intersected with the original arbitrarily shaped filter that includes both Date[Month] and Date[Calendar Year], resulting in the correct evaluation of the Total row.
Common use cases
For educational purposes, we used a simple example based on year and month to explain the concept of arbitrarily shaped filters. However, in this case iterating a column representing the correct cardinality of the operation – Date[Calendar Year Month] – would have been a better solution. This raises the question about when it is necessary to use KEEPFILTERS in iterators.
In general, every time you have to preserve the combination of columns coming from different tables, KEEPFILTERS is probably needed. Even though this could be required for columns of the same table, KEEPFILTERS is not required whenever there is a column that represents a cardinality higher than the intersection of the other columns – such as Date[Calendar Year Month] instead of the intersection of Date[Month] and Date[Calendar Year].
For example, the Budget model in DAX Patterns computes a forecast iterating the combinations of Product[Category] and Store[CountryRegion] with an expression similar to:
VAR Categories = VALUES ( 'Product'[Category] )
VAR Countries = VALUES ( Store[CountryRegion] )
VAR CategoriesCountries = CROSSJOIN ( Categories, Countries )
VAR ForecastValue =
    CALCULATE (
        SUMX (
            KEEPFILTERS ( CategoriesCountries ),
            VAR PYSalesAmount =  [Sales PY]
            VAR AllocationFactor = DIVIDE ( PYSalesAmount,  PYSalesAmountAtGrain )
            RETURN AllocationFactor * CurrentForecastedAmount
        ),
        KEEPFILTERS ( 'Product'[Year Del] < CurrentYear )
    )
RETURN ForecastValue
Conclusions
KEEPFILTERS can be applied to the context transition by wrapping around the table expression used in the iterator. Even though this is not a common requirement, you have to pay attention to the presence of arbitrarily shaped filters in the filter context and when you iterate complex tables made up of columns coming from different tables.
Evaluates an expression in a context modified by filters.
CALCULATE ( <Expression> [, <Filter> [, <Filter> [, … ] ] ] )
Evaluates a table expression in a context modified by filters.
CALCULATETABLE ( <Table> [, <Filter> [, <Filter> [, … ] ] ] )
Changes the CALCULATE and CALCULATETABLE function filtering semantics.
KEEPFILTERS ( <Expression> )
When a column name is given, returns a single-column table of unique values. When a table name is given, returns a table with the same columns and all the rows of the table (including duplicates) with the additional blank row caused by an invalid relationship if present.
VALUES ( <TableNameOrColumnName> )
Calculates the average (arithmetic mean) of a set of expressions evaluated over a table.
AVERAGEX ( <Table>, <Expression> )