 Alberto Ferrari
HASONEVALUE and ISINSCOPE are two DAX functions that are mostly used by developers to check the current level of a hierarchy. It is very common to see code snippets like the following, to show the value only at the Year level and below:
IF (
    ISINSCOPE ( Date[Year] ),
    TOTALYTD ( … )
)
You can obtain a similar behavior by using HASONEVALUE:
IF (
    HASONEVALUE ( Date[Year] ),
    TOTALYTD ( … )
)
To most DAX coders, the two versions of the formula yield the same result. But in fact, this is not true. ISINSCOPE and HASONEVALUE serve different purposes, and they have a different impact on performance. Learning when to use either of those functions is important to obtain efficient formulas.
Even though the two functions are different in their implementation, their net result is very close. Therefore, in order to choose which one to use, it is necessary to clearly understand the scenarios where they produce a different result.
Let us start with the definition of the two functions:
- HASONEVALUE checks that a column has exactly one value visible in the current filter context.
- ISINSCOPE checks that a column is currently being filtered because it is part of a grouping performed by a summarizing function.
With the aid of a report, let us check how the functions behave in different cells of the matrix.
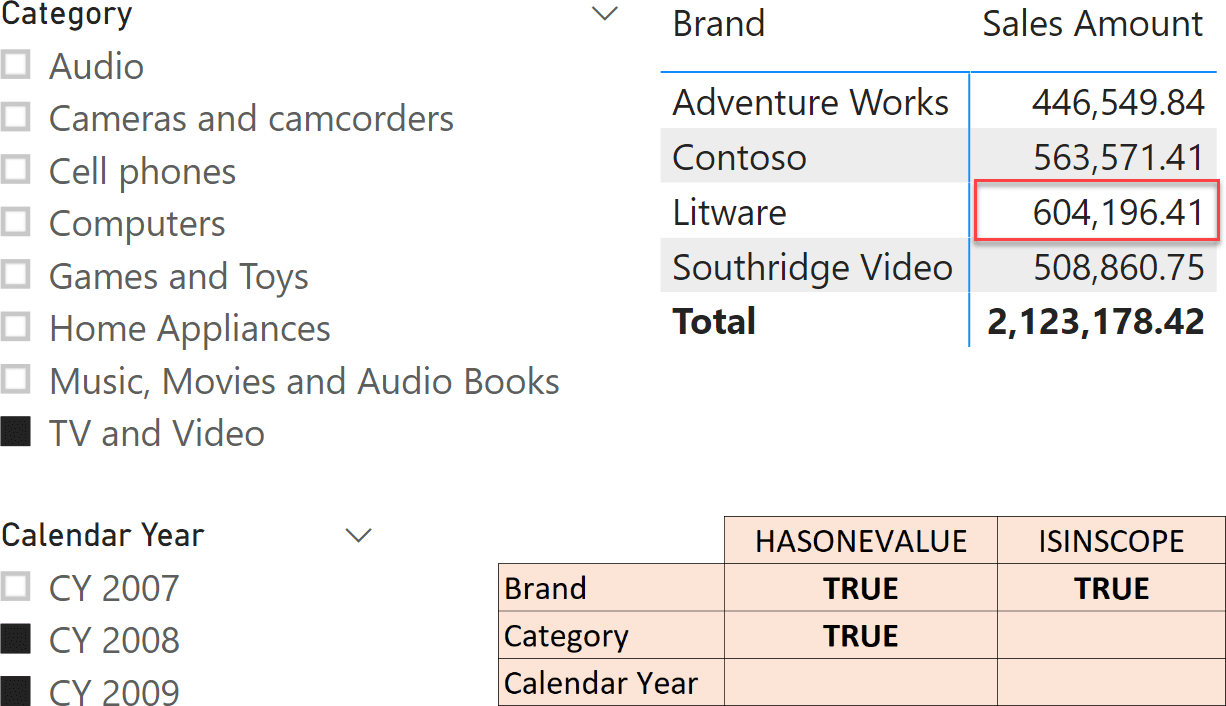
Focus on the highlighted cell:
- Brand has one value visible, because it is filtered by the matrix. Brand is also being grouped by the query generated by Power BI to create the matrix. For this reason, both HASONEVALUE and ISINSCOPE are TRUE.
- Category has only one value visible, due to the filter coming from the slicer. This is why HASONEVALUE is TRUE. But because Category is not part of the matrix, ISINSCOPE is FALSE.
- Calendar Year has two values visible, because of the slicer. It is not part of the matrix; because of this, no grouping is happening. Both functions yield FALSE.
The first point, Brand, deserves a better explanation. How come a matrix – or any visual – is performing a grouping? When Power BI needs the results for a visual, it runs a DAX query. The query often uses SUMMARIZECOLUMNS to perform a grouping by the columns (Brand, in this case) that the user puts on rows or on columns. Therefore, each cell is evaluated in a filter context that contains one value for a column currently being grouped by.
As a reference, this is the query that generates the matrix – just a bit polished to make it more readable:
EVALUATE
SUMMARIZECOLUMNS (
    ROLLUPADDISSUBTOTAL ( 'Product'[Brand], "IsGrandTotalRowTotal" ),
    TREATAS ( { "TV and Video" }, 'Product'[Category] ),
    TREATAS ( { "CY 2009", "CY 2008" }, 'Date'[Calendar Year] ),
    "Sales_Amount", 'Sales'[Sales Amount]
)
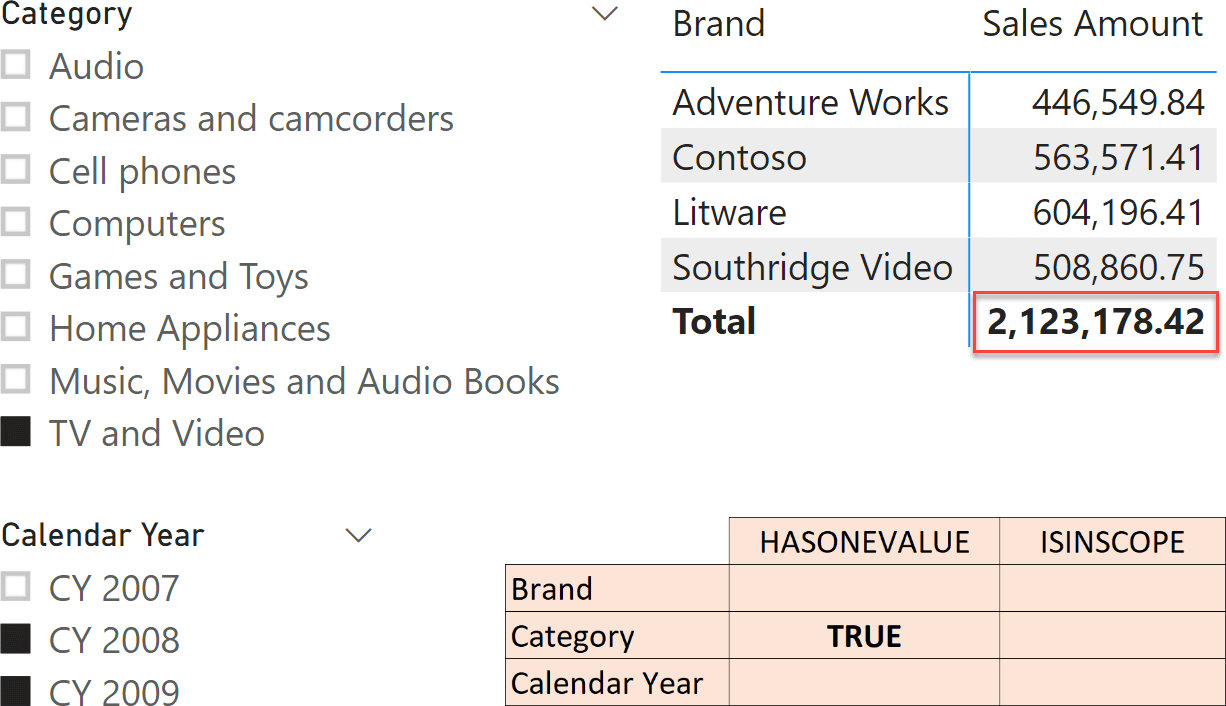
As you can see from the query, Sales Amount is computed by SUMMARIZECOLUMNS during the grouping by Product[Brand]. The two TREATAS (the slicers) perform a filter, but they do not participate in the grouping. Product[Brand] is being grouped by, and it also participates in the filtering.
At the grand total, the scenario is different because the grand total is still computed by SUMMARIZECOLUMNS, but without any grouping active. This is why at the grand total Brand neither has one value, nor is it in scope.
As a rule of thumb – you use ISINSCOPE when you want to detect which level of a hierarchy you are browsing in a report; on the other hand, you use HASONEVALUE to check if the user has selected exactly one value either from a slicer, or when using a grouping in a visual.
In other words, you use ISINSCOPE when the check you need to perform is strictly tied to the visual, like when you need to change the behavior of a measure at the grand total. You use HASONEVALUE when a measure can be computed only when a single value is selected, either from a visual or from a slicer. For example, a year-to-date value only makes sense when a single year is selected, no matter where the filter comes from.
There is a big difference between the two functions in terms of performance. HASONEVALUE needs to count the values of a column. The value of ISINSCOPE does not depend on how many values are visible: either there is an active grouping, or there is not. Consequently, ISINSCOPE is faster than HASONEVALUE.
At first sight, it looks like ISINSCOPE should be preferred: it is faster and lets you distinguish between grouping in the visual and filtering with a slicer. Nevertheless, here is a caveat: ISINSCOPE does not guarantee that there is a single value. When ISINSCOPE is TRUE, there can be either zero or one value. This is not an issue in most scenarios – but sometimes the difference between zero and one is relevant. In that scenario, HASONEVALUE is slower but provides a better solution.
As an example, look at the following query. It was generated by Power BI, with a measure that ranks the orders based on the order number. Because the ranking column should only be displayed if the row in the table is only showing one order number, we protect it with ISINSCOPE:
DEFINE
    MEASURE Sales[Ranking] =
        VAR OrderNumbers =
            CALCULATETABLE ( VALUES ( Sales[Order Number] ), ALLSELECTED () )
        VAR CurrentOrder =
            SELECTEDVALUE ( Sales[Order Number] )
        VAR Result =
            IF (
                ISINSCOPE ( Sales[Order Number] ),
                RANKX ( OrderNumbers, Sales[Order Number], CurrentOrder, ASC )
            )
        RETURN
            Result
    VAR __DS0FilterTable =
        TREATAS ( { DATE ( 2009, 11, 8 ) }, 'Date'[Date] )
EVALUATE
SUMMARIZECOLUMNS (
    'Sales'[Order Number],
    'Product'[Product Name],
    __DS0FilterTable,
    "Ranking", [Ranking],
    "Sales_Amount", 'Sales'[Sales Amount]
)
On our Contoso model, this query – that works on a single day – takes around 14 seconds to run. If you are interested in optimizing DAX, we can only suggest that you stop reading, download the demo file and run the query in DAX Studio. Spend some time not only optimizing it – given the topic of the article, the optimization should be an easy feat – but also understanding exactly why it is so slow. Trust us, it will be time well spent!
The problem of this query is that it is summarizing by Sales[Order Number] and Product[Product Name]. Because the two columns are in different tables, DAX needs to inspect the full cross-join of their values.
Now, the cross-join of Sales[Order Number] and Product[Product Name] is huge: 21,601 x 2,517 = 54,369,717 rows. Most of the combinations do not have transactions in Sales: given an order number, it contains few products, not all of them. Regardless, the engine needs to inspect the full cross-join because of the way the query was authored. For each row, it needs to decide whether to compute the ranking or not.
The calculation of the ranking is protected with ISINSCOPE – for this reason, it turns out that the order number is always in scope even though it shows zero value. Indeed, for that product there are no orders. Despite being fast, ISINSCOPE is not the function to use here. If we replace ISINSCOPE with HASONEVALUE, the query goes from taking 14 seconds to taking 24 milliseconds:
VAR Result =
    IF (
        HASONEVALUE ( Sales[Order Number] ),
        RANKX ( OrderNumbers, Sales[Order Number], CurrentOrder, ASC )
    )
This does not mean that HASONEVALUE is preferable. As stated earlier, the semantics of the two functions is different. Although both functions can be used in many scenarios, knowing the difference between the two helps you make an educated choice in scenarios like the one shown in this article.
Returns true when there’s only one value in the specified column.
HASONEVALUE ( <ColumnName> )
Returns true when the specified column is the level in a hierarchy of levels.
ISINSCOPE ( <ColumnName> )
Create a summary table for the requested totals over set of groups.
SUMMARIZECOLUMNS ( [<GroupBy_ColumnName> [, [<FilterTable>] [, [<Name>] [, [<Expression>] [, <GroupBy_ColumnName> [, [<FilterTable>] [, [<Name>] [, [<Expression>] [, … ] ] ] ] ] ] ] ] ] )
Treats the columns of the input table as columns from other tables.For each column, filters out any values that are not present in its respective output column.
TREATAS ( <Expression>, <ColumnName> [, <ColumnName> [, … ] ] )