 Marco Russo
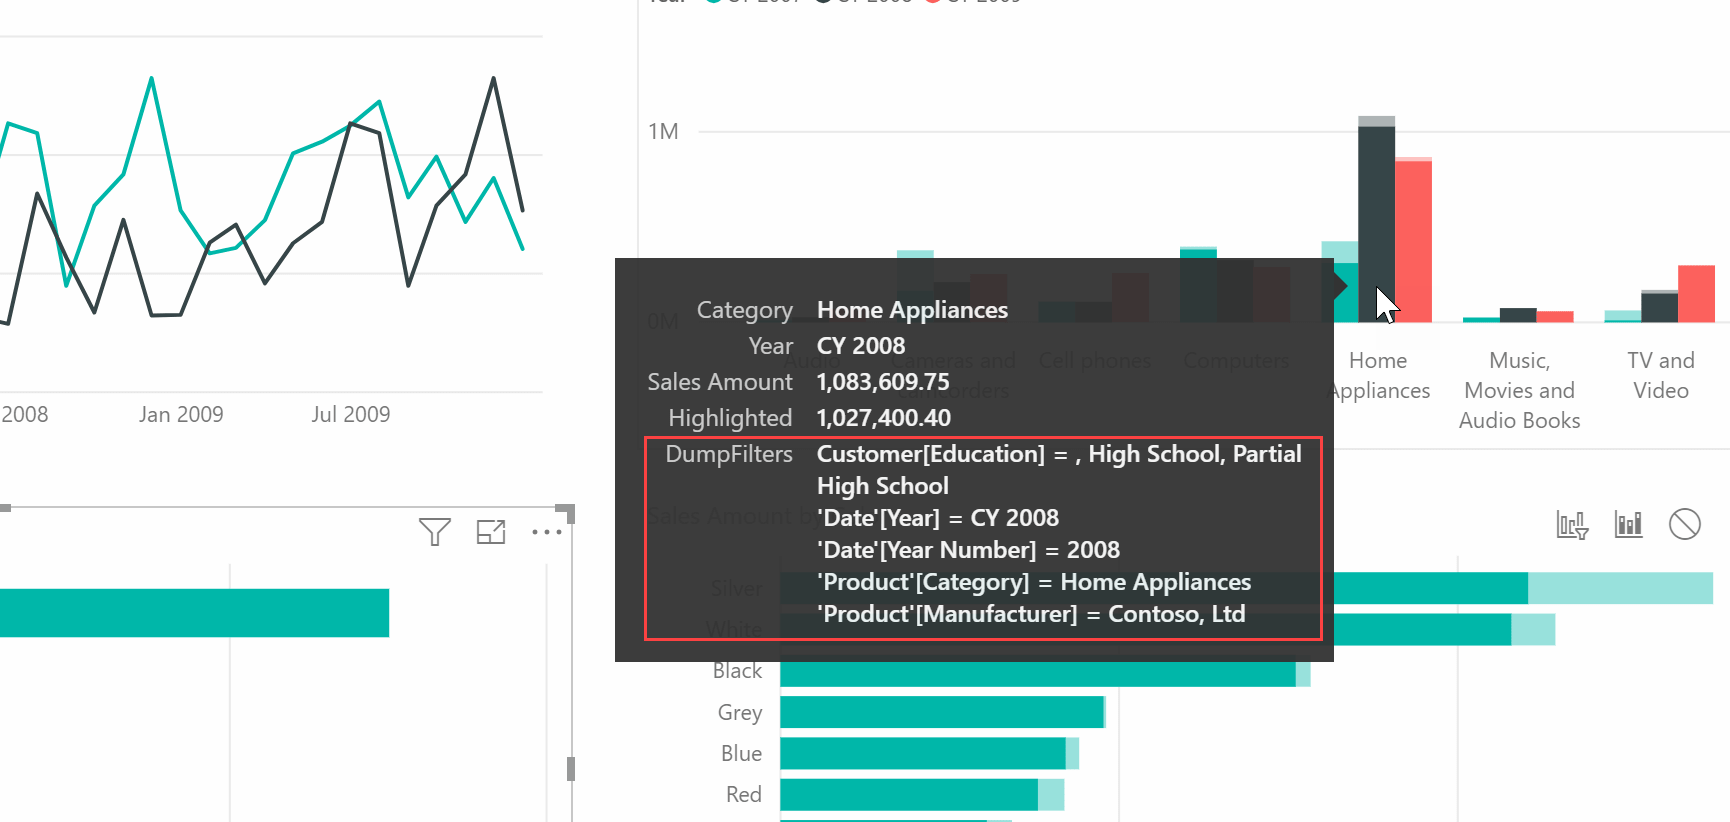
Understanding the filter context applied to a measure in a Power BI report can be a challenging task. Filters can be applied at the report, page, and visual levels. Every visual element in a report can filter other visuals in the same page. Determining the exact filter in complex reports can be an expensive but necessary task during report validation or debugging. For example, the following screenshot shows the DumpFilters measure applied to a Tooltip in a clustered column chart.
The DAX code required to build the string returned by the DumpFilters measure is verbose and repetitive. Therefore, it is a good idea to generate it automatically using DAX Studio.
Creating a DumpFilters measure in DAX Studio
The 2.8 version of DAX Studio introduced a feature to define a “Filter Dump” measure. The purpose of this measure is to analyze the filter context of every column of the model (or of only one table), creating a string with the name of the columns that have an active filter in the filter context followed by the items that are applied as a filter. In order to create that measure, right-click on a table name in the Metadata pane of DAX Studio and select one of the highlighted menu items.
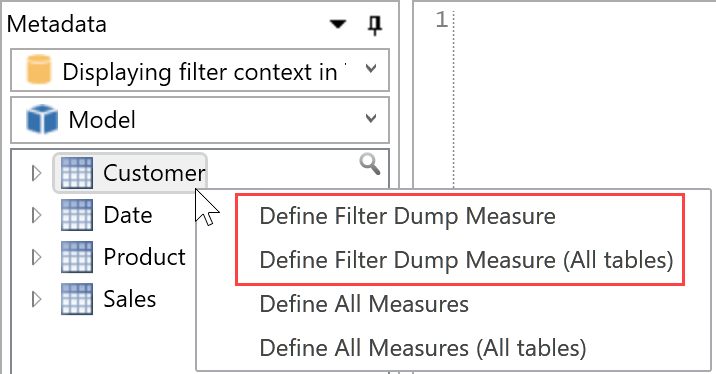
The difference between the two options is just in the tables being considered for the filter context analysis:
- Define Filter Dump Measure creates a measure that analyzes the filter context applied to all the columns of the selected table.
- Define Filter Dump Measure (All tables) creates a measure that analyzes the filter context applied to all the columns of all the tables in the model, regardless of the selected table.
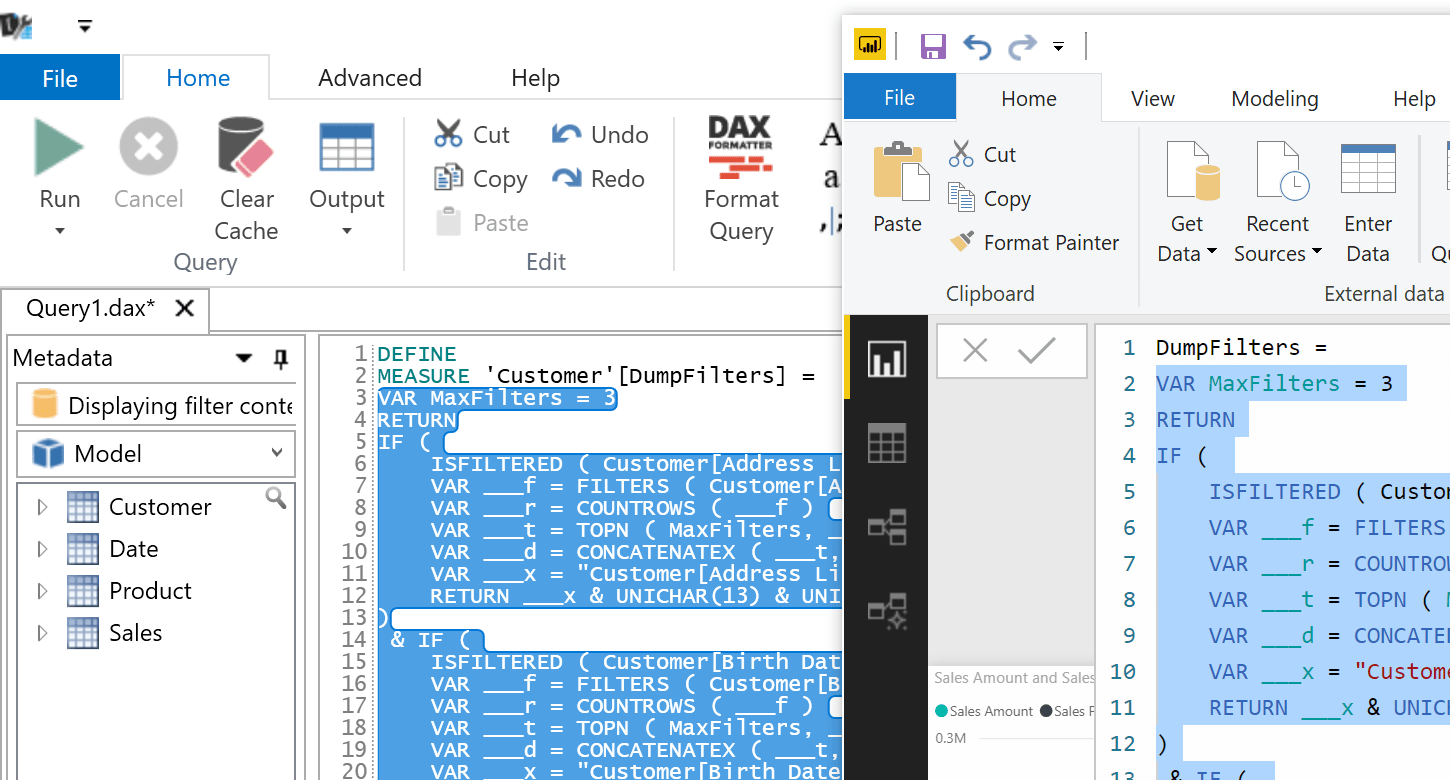
For example if you connect DAX Studio to the Power BI model used for this article, you can select the Define Filter Dump Measure (All tables) menu item; you obtain the following DAX code in the DAX Studio editor:
DEFINE
MEASURE 'Customer'[DumpFilters] =
VAR MaxFilters = 3
RETURN
IF (
    ISFILTERED ( Customer[Address Line 1] ),
    VAR ___f = FILTERS ( Customer[Address Line 1] )
    VAR ___r = COUNTROWS ( ___f )
    VAR ___t = TOPN ( MaxFilters, ___f, Customer[Address Line 1] )
    VAR ___d = CONCATENATEX ( ___t, Customer[Address Line 1], ", " )
    VAR ___x = "Customer[Address Line 1] = " & ___d
                   & IF(___r > MaxFilters, ", ... [" & ___r & " items selected]") & " "
    RETURN ___x & UNICHAR(13) & UNICHAR(10)
)
 & IF (
    ISFILTERED ( Customer[Birth Date] ),
    VAR ___f = FILTERS ( Customer[Birth Date] )
    VAR ___r = COUNTROWS ( ___f )
    VAR ___t = TOPN ( MaxFilters, ___f, Customer[Birth Date] )
    VAR ___d = CONCATENATEX ( ___t, Customer[Birth Date], ", " )
    VAR ___x = "Customer[Birth Date] = " & ___d
                   & IF(___r > MaxFilters, ", ... [" & ___r & " items selected]") & " "
    RETURN ___x & UNICHAR(13) & UNICHAR(10)
)
-- this continues for the other columns in the data model
The DAX code of this measure checks every column of the data model. If a filter is applied over the column (ISFILTERED), the list of the values applied to the filter context (FILTERS) is concatenated into a string (CONCATENATEX), limiting the number of items visible (COUNTROWS and TOPN) to the number defined in the MaxFilters variable. The string returned by the measure includes the column name before the list of values included in the filter context. If the selection has more than MaxFilters items, then the string displays MaxFilters items followed by the total number of items selected. You can change the MaxFilters variable if you want to include more than three items in this result.
The measure obtained this way must be copied into a new measure in Power BI Desktop in order for it to be used in a Tooltip.
Copying a DumpFilters measure in Power BI Desktop
In order to copy the DumpFilters measure from DAX Studio to Power BI Desktop, follow these two steps:
- Select the definition of the measure in DAX Studio skipping the first two rows (DEFINE and MEASURE) and copy it into the clipboard.
- Create a new measure in Power BI Desktop named DumpFilters; paste the code you copied from DAX Studio after the assignment operator (=).
Once you have defined the DumpFilters measure in Power BI Desktop, you can move it to the Tooltips area of a visual that supports Tooltips, like the clustered column chart of the first screenshot shown in this article.
The Tooltips can display a string with multiple lines. This is useful for the DumpFilters measure that creates a new line for every column with a filter. You might wonder why the DumpFilters measure is required considering that Power BI can already display any filters and slicers affecting a visual. The reason is that the DumpFilters measure isolates the filters of a single cell and can show the effects of filters that are not visible in the standard visualization provided by Power BI.
Understanding the DumpFilters measure results
The DumpFilters measure shows any filter applied to a number calculated in a visual, no matter the source. This includes:
- Report-level filters
- Page-level filters
- Slicers affecting the page
- A selection made in other visuals of the same page that filters the visual
- Fields included in the visual to group data (like Axis, Legend, Category, Rows, Columns, …)
For example, consider this visualization of the Tooltip in the Clustered Column Chart visual of the Simple Filters page included in the sample PBIX you can download.
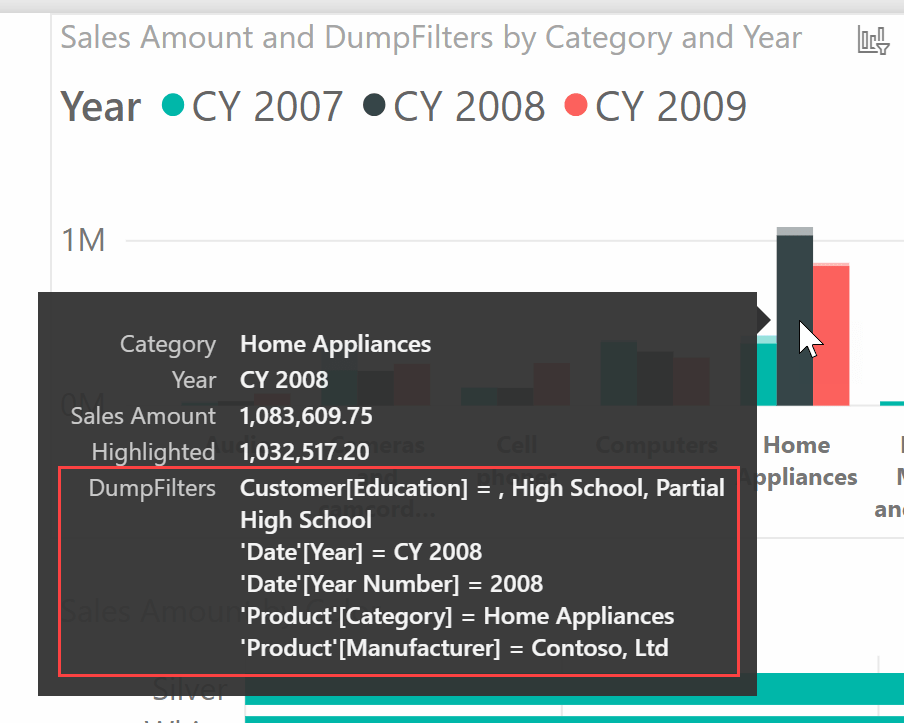
This is the explanation of the filters visible in DumpFilters:
- Customer[Education] is a report-level filter.
- Product[Manufacturer] is a page-level filter.
- Product[Category] is the attribute applied to the Axis property of the visual.
- Date[Year] is the attribute applied to the Legend property of the visual.
- Date[YearNumber] is the column used to sort Date[Year] and it is included in the filter context whenever a filter is applied to Date[Year].
The visual also has a cross highlighting filter coming from Customer[Occupation] which is not visible in the filter context, because the measure in the Tooltips is evaluated by Power BI outside of any cross highlighting filter. It is useful to compare the result of the DumpFilters measure with the information provided by the filters shown in the visual header. (Note: The visual header shows the filters applied to the visual when you check the option “Enable the updated filter pane, and show filters in the visual header for this report” in the Report settings of the current file.)
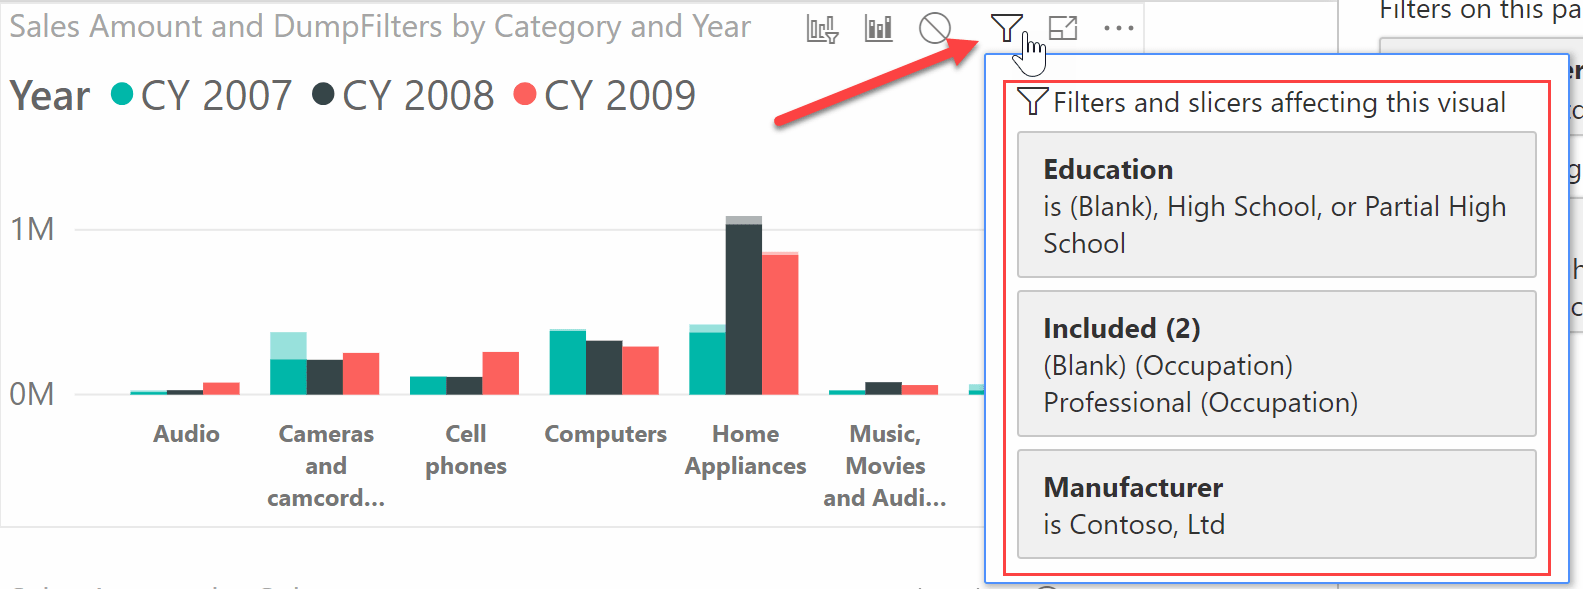
This is the explanation of the filters visible in the visual header:
- Customer[Education] is a report-level filter.
- Product[Manufacturer] is a page-level filter.
- Customer[Occupation] is a cross highlighting filter – you can identify this state because of the “Included” title.
As you see, the visual header shows filters applied outside of the visual, including slicers and cross highlighting filters, but it does not show visual-level filters, which are visible in the DumpFilters measure. Visual-level filters might affect the result in a non-intuitive way when they are applied to a measure included in the visual, as described in the next example.
Understanding the impact of visual-level filters
A visual-level filter based on a measure always applies a restriction to the members visible in the visual at the maximum level of detail. For example, consider the following line chart in the Visual Filters page of the sample PBIX file you can download.
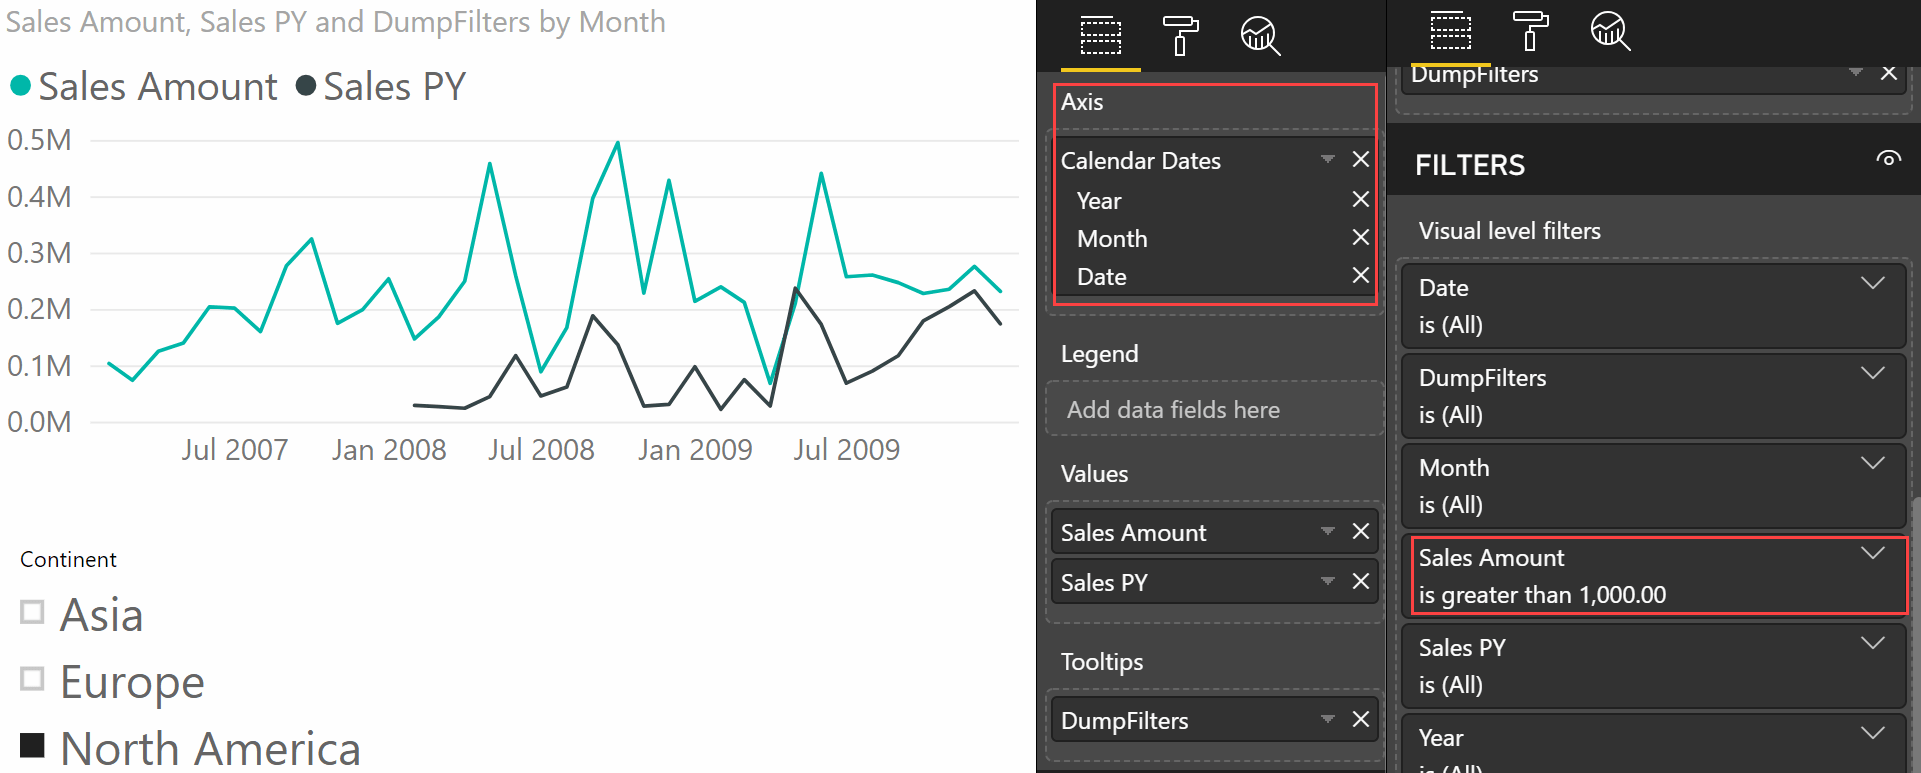
The line chart has three levels in the Axis: Year, Month, and Date. However, the line chart is currently displaying the Month level. The “Visual level filters” pane contains a condition for the Sales Amount measure, which must be greater than 1,000. What are the effects of this configuration on the filters applied to the visual?
This time we consider the filters displayed in the visual header first.
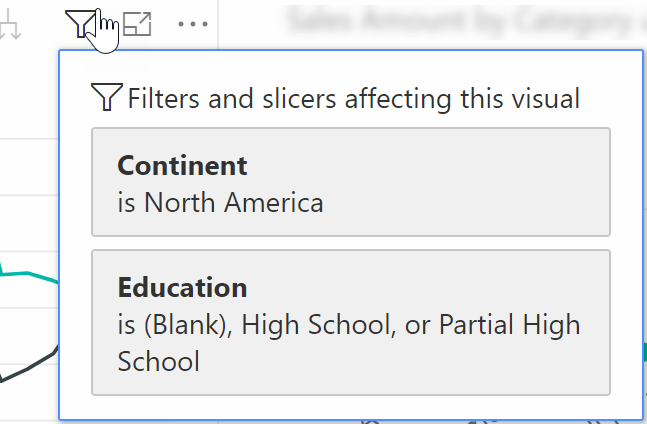
This is the explanation of the filters visible in the visual header:
- Customer[Education] is a report-level filter.
- Customer[Continent] is a filter coming from the Continent slicer included in the same page.
As usual, the visual header does not include any evidence of the visual-level filters. Compare this with the result of the DumpFilters measure analyzed for one point of the line chart.
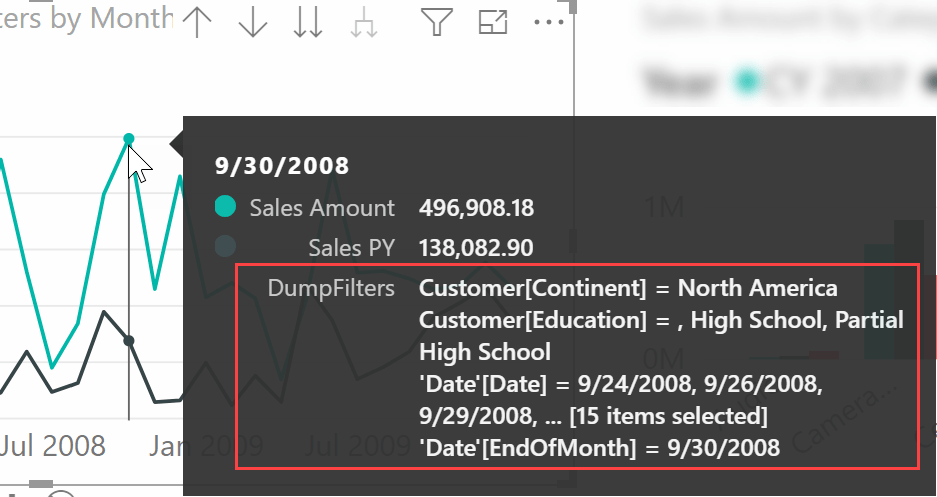
This is the explanation of the filters visible in DumpFilters:
- Customer[Education] is a report-level filter.
- Customer[Continent] is a filter coming from the Continent slicer included in the same page.
- Date[EndOfMonth] is a filter coming from the Axis; it corresponds to the column used for the Month level of the Calendar Dates hierarchy included in the Axis property of the line chart.
- Date[Date] is a filter coming from the Sales Amount condition applied to the visual-level filters.
The non-intuitive part of the filter is that by filtering a measure you are filtering the maximum level of detail of the visual. In a line chart, this is the intersection of all the attributes applied to the Axis and to the Legend properties. In this case there are no attributes on the Legend property and the maximum level of detail is the Date[Date] column. Indeed, the filter applied to the Sales Amount measure generates a list of dates that satisfy the visual-level filter – this list of dates has 15 dates for the point analyzed. Therefore, the month of September 2008 displayed in the line chart does not include all the other dates that have a Sales Amount value less than or equal to 1,000.
Creating a DumpFilters measure in Tabular Editor
If you use Tabular Editor, you can use a script created by Daniel Otykier that adapted the code described in this article. This way you can generate the measure directly into the data model. This is supported for Analysis Services, but not for Power BI yet (which means that it works, but you use it at your own risk).
Conclusions
Displaying the exact filter context applied to a number computed in a Power BI report can be extremely useful in order to understand the behavior of a measure that is not producing the expected results. Sometimes we forget the effects of visual-level filters, or we simply do not realize the outcome of complex filter conditions applied to a visual.
DAX Studio can produce a measure that generates a string with a detailed description of the filter context. You can copy and paste this measure in a Power BI report, and use that measure in the Tooltips of a chart. Currently, Power BI Desktop does not support Tooltips for Table and Matrix visuals. If you need to display the Tooltips for debugging purposes, you can temporarily transform the visual into a chart so you can use the Tooltips properties.
EDIT 2019-02-25 Matt Chaplin suggested a good workaround for the lack of Tooltips support in Table and Matrix visuals. You can create a report tooltip page including a Table or a Card visual, enabling Word Wrap, adapting the size and setting a font that allows you to see the filter context content in a report tooltip. This require some work, but enabling this feature in Matrix and Table visuals definitely worth the effort!
Returns true when there are direct filters on the specified column.
ISFILTERED ( <TableNameOrColumnName> )
Returns a table of the filter values applied directly to the specified column.
FILTERS ( <ColumnName> )
Evaluates expression for each row on the table, then return the concatenation of those values in a single string result, seperated by the specified delimiter.
CONCATENATEX ( <Table>, <Expression> [, <Delimiter>] [, <OrderBy_Expression> [, [<Order>] [, <OrderBy_Expression> [, [<Order>] [, … ] ] ] ] ] )
Counts the number of rows in a table.
COUNTROWS ( [<Table>] )
Returns a given number of top rows according to a specified expression.
TOPN ( <N_Value>, <Table> [, <OrderBy_Expression> [, [<Order>] [, <OrderBy_Expression> [, [<Order>] [, … ] ] ] ] ] )