Hierarchies

Hierarchies are often created in data models to simplify the browsing of the model by providing users with suggested paths of navigation through attributes. The definition of the hierarchies follows the requirements of the model. For example, the Date table usually contains a hierarchy with levels like year, quarter, month, and day. Similarly, the Product table usually includes a common hierarchy like Category, Subcategory and Product.
Hierarchies make it possible to insert multiple columns at once in a report, but hierarchies are also useful to drive calculations. For example, a measure can show sales as a percentage over the parent of the current level of the hierarchy. Any other calculation can use the same approach by just customizing the calculation associated to each level of the hierarchy.
Detecting the current level of a hierarchy
Any calculation involving hierarchies requires the DAX code to detect the current level of the hierarchy. Therefore, it is important to understand how to detect the level of a hierarchy where a measure is being evaluated. Figure 1 shows the Product Level measure whose only goal is to detect the hierarchy level being browsed. The Product Level measure is usually hidden in the model because it is only used in other measures and implements a calculation related to the hierarchy level.
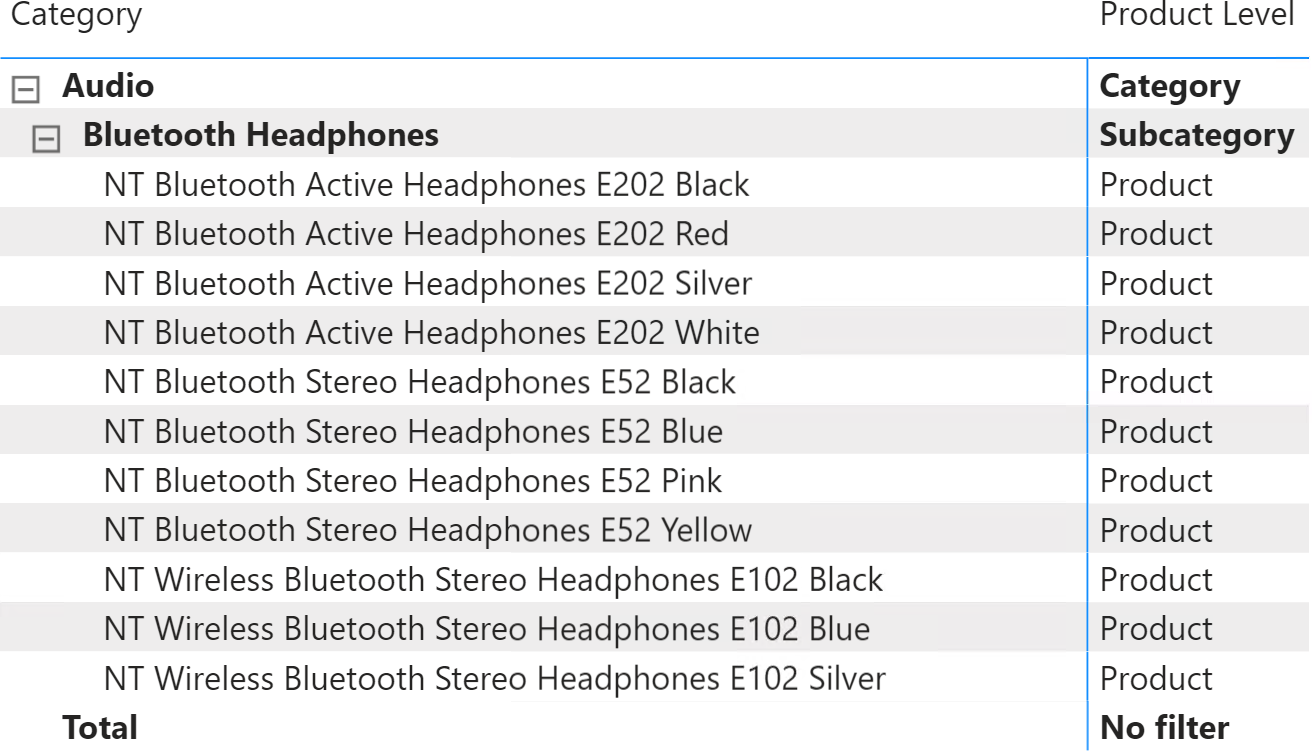
The Product Level measure is defined as follows:
Product Level :=
VAR IsProductInScope = ISINSCOPE ( 'Product'[Product Name] )
VAR IsSubcatInScope = ISINSCOPE ( 'Product'[Subcategory] )
VAR IsCatInScope = ISINSCOPE ( 'Product'[Category] )
VAR Result =
    SWITCH (
        TRUE (),
        IsProductInScope, "Product",
        IsSubcatInScope, "Subcategory",
        IsCatInScope, "Category",
        "No filter"
    )
RETURN
    Result
By using ISINSCOPE, the three variables IsProductInScope, IsSubcatInScope, and IsCatInScope check whether each level of the hierarchy is currently being grouped by. In that case, the corresponding column has a single value visible in the filter context.
The SWITCH statement detects the level by looking for the first level visible starting from the more granular one. The order of the conditions in SWITCH is relevant. Indeed, when the product is in scope, both category and subcategory are in scope too. Therefore, the measure must check the most restrictive filter first. The evaluation of the active level must always start from the lowest level of the hierarchy, and move up one step at a time.
The Product Level measure is of no use by itself. The technique used in the measure is frequently used to implement a calculation depending on the current level of the hierarchy. We use this measure as a convenient way to detect the hierarchy level in the measures described further in this pattern.
NOTE When ISINSCOPE is not available, ISFILTERED can be used as an alternative technique – this is the case in Excel up to version 2019. However, by using ISFILTERED, the DAX expression operating over hierarchies must assume that the levels beyond the top-level of the hierarchy displayed in a visualization are not filtered outside of the visualization itself – that is, they should not be used in slicers, filters, or selected in other visuals. In order to prevent the user from doing that, if ISINSCOPE is not available it is a best practice to create a hierarchy using only hidden columns – this means duplicating the columns used in levels of a hierarchy so that they are also available as separate filters and slicers without affecting the DAX calculations over the hierarchy itself.
Percentage of parent node
A common hierarchical calculation shows a measure as a percentage over the parent node, as shown in Figure 2.
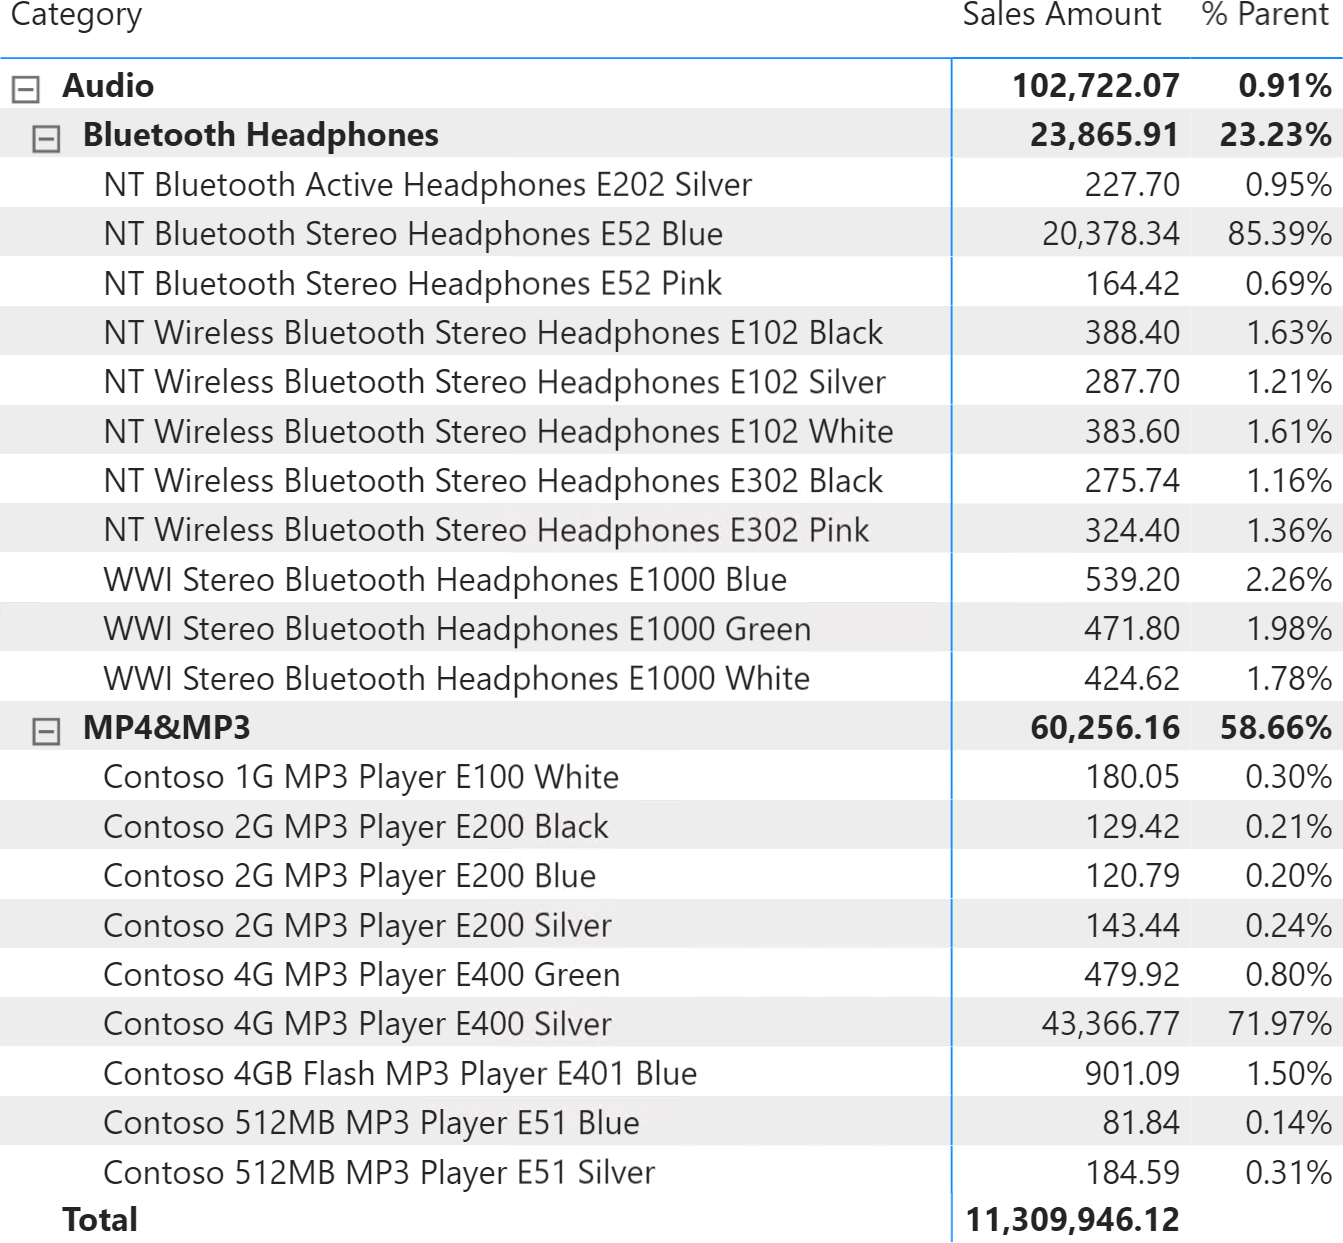
The % Parent measure detects the level of the hierarchy for the cell being evaluated and uses the value of the parent at the denominator of the ratio:
% Parent :=
VAR AllSelProds =
    ALLSELECTED ( 'Product' )
VAR ProdsInCat =
    CALCULATETABLE (
        'Product',
        AllSelProds,
        VALUES ( 'Product'[Category] )
    )
VAR ProdsInSub =
    CALCULATETABLE (
        'Product',
        ProdsInCat,
        VALUES ( 'Product'[SubCategory] )
    )
VAR Numerator = [Sales Amount]
VAR Denominator =
    SWITCH (
        [Product Level],
        "Category", CALCULATE ( [Sales Amount], AllSelProds ),
        "Subcategory", CALCULATE ( [Sales Amount], ProdsInCat ),
        "Product", CALCULATE ( [Sales Amount], ProdsInSub )
    )
VAR Result =
    DIVIDE (
        Numerator,
        Denominator
    )
RETURN
    Result
Returns true when the specified column is the level in a hierarchy of levels.
ISINSCOPE ( <ColumnName> )
Returns different results depending on the value of an expression.
SWITCH ( <Expression>, <Value>, <Result> [, <Value>, <Result> [, … ] ] [, <Else>] )
Returns true when there are direct filters on the specified column.
ISFILTERED ( <TableNameOrColumnName> )
This pattern is designed for Power BI / Excel 2016-2019. An alternative version for Excel 2010-2013 is also available.
This pattern is included in the book DAX Patterns, Second Edition.


Video

Do you prefer a video?
This pattern is also available in video format. Take a peek at the preview, then unlock access to the full-length video on SQLBI.com.Watch the full video — 11 min.
Downloads
Download the sample files for Power BI / Excel 2016-2019: