A very frequent question, when performing business analysis, is to count the number of working days in a certain period of time. Creating a data model with PowerPivot that gracefully handles working days is pretty easy, nevertheless it is worth a post.
As you might already know, PowerPivot needs a calendar table to compute most of its time intelligence functions and this table needs to satisfy some important conditions:
- There should be no hole in the whole calendar, i.e. all dates of a year should be present.
- The key of the table should be of DATETIME type.
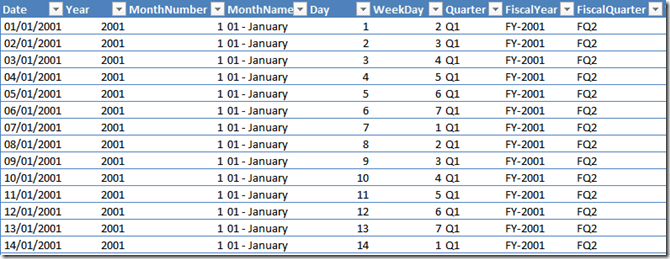
Building this table is really straightforward using Excel: start filling a column with dates (use alt-dragging to fill it very quickly) and then add some very simple formulas to the worksheet, to obtain a table like the following one. Clearly, the number of dates that should be included in the table really depends on your data, always remember that the table should always start at the 1st of January and end at the 31 of December, with all the necessary years included. Leaving a hole means getting wrong data later.
Before loading the table inside PowerPivot, it is necessary to add some info about working days and vacation, due to the title of this post. To do this, let us create a new Excel table containing the holidays, with a description of the non working reason, like the following one:

You can add as many vacation days as you need to this table (and, if you wonder whether I consider holding a PowerPivot Workshop vacation… well, I surely enjoy it: it is very close to vacation!). Then, using Excel VLOOKUP function, we can bring the information about vacation directly inside the Calendar table, which now will contain some new columns:
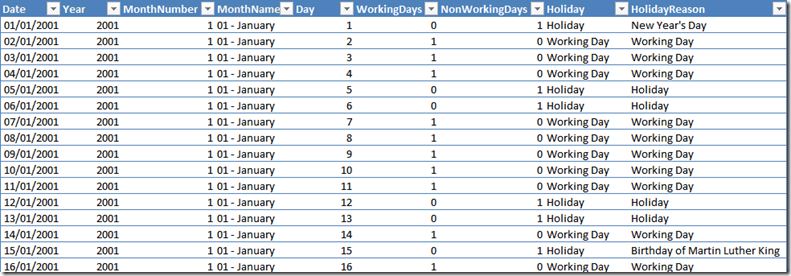
The interesting formulas are:
- WorkingDays =IF (OR ([@WeekDay] = 6, [@WeekDay] = 7), 0, IF (ISNA (VLOOKUP ([@Date], HolidaysTable[#Data], 2, FALSE)), 1, 0))
- Holiday =IF([@WorkingDays]=0,”Holiday”,”Working Day”)
- HolidayReason =IF (ISNA (VLOOKUP ([@Date], HolidaysTable[#Data], 2, FALSE)), [@Holiday], VLOOKUP ([@Date], HolidaysTable[#Data], 2, FALSE))
Here we state that a day is a working day if it is not Saturday or Sunday and it does not appear in the holidays table. Other formulas are very simple ones and define a string representation of holiday and holiday reason, as you can see from the figure. Please note that the WorkingDays column is an integer, holding 0 or 1. Moreover, I decided to name it plural instead of singular… this is not a mistake, it will make sense in the next figure.
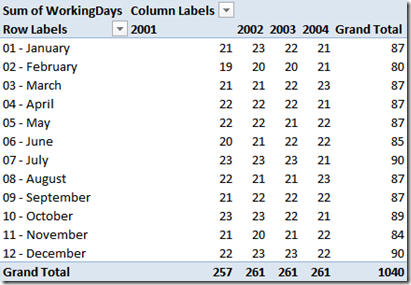
If you now create a PivotTable using only the new Calendar table and put Year on columns, MonthName on rows and the WorkingDays column as value, you get this first nice result, which shows the number of working days for each month. Due to the fact that the value is computed by simply summing values, it works even with different period selections, with or without holes.
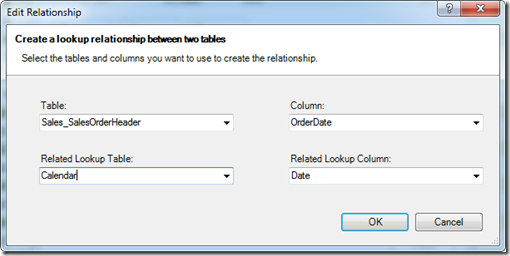
I have already put inside PowerPivot some tables coming from the AdventureWorks database, in particular iI have the SalesOrderHeader table, which contains the OrderDate. Thus, I can create a relationship based on the order date, as you can see in the following figure:
Having done this, you can use the WorkingDays column to compute, for example, the average amount sold per working day, using this formula:
AmountPerWorkingDay=SUM (SalesOrderDetail[LineTotal]) / SUM (Calendar[WorkingDays])
Which provides an interesting report:
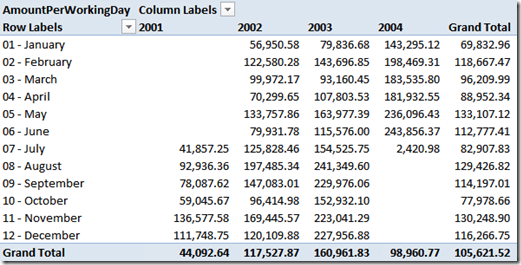
Well… this report looks interesting, yet it is not working as we would expect, since the average of 2001 is not 44,092,64. The issue here is that the sum of working days in 2001 is 257 but not all the months contain values for sales, yet their working days are counted in the denominator. If we really strive for perfection (which we do) then it is necessary to leverage some basic DAX knowledge and change the formula of the AmountPerWorkingDay to filter out the months where there are no sales. A more correct formula is the following:
=
SUM ( SalesOrderDetail[LineTotal] )
    / SUMX (
        VALUES ( Calendar[MonthNumber] ),
        IF (
            CALCULATE ( SUM ( SalesOrderDetail[LineTotal] ) ) = 0,
            0,
            CALCULATE ( SUM ( Calendar[WorkingDays] ) )
        )
    )
The complete explanation is a bit long, here we basically iterate over months and, if a month does not contain values for the sales, we remove it from the count of working days. Take some time to study it, then move on. The result is:
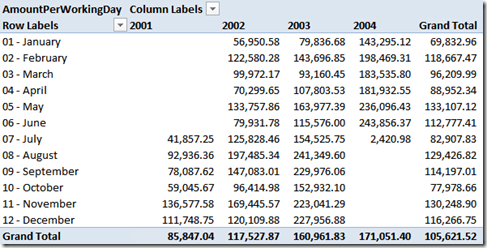
Which now shows the correct result and a good course in the value, which grows year over year. AdventureWorks business is going in the right direction!
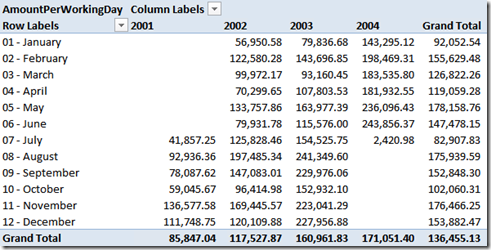
Nevertheless, as it has been correctly noted by @Reuvain in the comments, the Grand Total column is still incorrect, since we have solved the issue with months but not with years. The value of zero over January, 2001 is counted to perform the average of January Grand Total. To solve this issue we need to iterate over years too, as in this (please note the outer and inner loop, over years and months).
=
SUM ( SalesOrderDetail[LineTotal] )
    / SUMX (
        VALUES ( Calendar[Year] ),
        SUMX (
            VALUES ( Calendar[MonthNumber] ),
            IF (
                CALCULATE ( SUM ( SalesOrderDetail[LineTotal] ) ) = 0,
                0,
                CALCULATE ( SUM ( Calendar[WorkingDays] ) )
            )
        )
    )
Using this new formula the values will be correct at the grand total column too:
Now that we can decide whether a day is working or not, there is another very interesting computation that I would like to show: computing the difference, in working days, between two dates. Computing the delta between two dates is a matter of a subtraction in PowerPivot, since dates are stored internally as floating numbers. But, how many working days do exist between two dates is a different problem, which requires some DAX acrobatics.
Before moving on, we understand that we need at least two dates to perform a delta. Luckily, in the SalesOrderHeader table there are the OrderDate and the ShipDate, it might be interesting to calculate the difference, in working days, between these two dates. Now, time to think at the algorithm.
The main idea is to assign an incremental number, to each date, that increases by 1 only on working days and remains the same over holidays. It is much easier to understand it looking at the next figure, the value of WorkingDayNumber in the box.
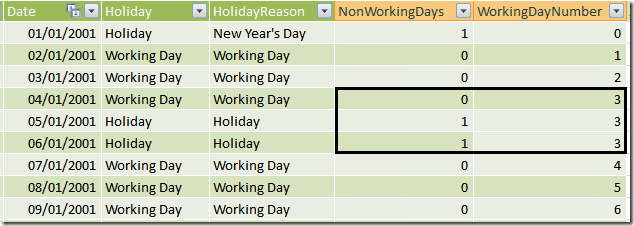
You can see that the WorkingDayNumber column contains the value 3 from January 4 to January 6, since the last two days are vacation. If we had such a value, then to compute the delta in working days between two dates, it would be enough to perform a simple subtraction between the two WorkingDayNumbers. Now, the issue is how to compute such a value.
It is not easy if you are not familiar with the way PowerPivot formulas need to be expressed but, believe me, after some time with PowerPivot the formula will come to your mind in a snap. The idea is to define a calculated column that counts the number of dates before the current one filtering only working days. Or, said in other words, sum 1 for working days, 0 for holidays, for all the dates that exist before the current one. Guess what? We have a column that contains 0 for vacation and 1 for working days: it is the WorkingDays column, so we need to sum it up for all the dates before the current one.
Here is the formula:
WorkingDayNumber = CALCULATE (SUM(Calendar[WorkingDays]), Calendar[Date] <= EARLIER(Calendar[Date]))
Take your time to study and understand it… it is something that requires you to have already touched the Karma of PowerPivot… Once you have digested it, it is time to bring this information inside the SalesOrderHeader table. In fact, the SalesOrderHeader table contains two dates (ShipDate and OrderDate) but we need to compute the difference between the related WorkingDayNumber, which are not part of the SalesOrderHeader table.
Since there exists a relationship between SalesOrderHeader and the calendar table, the value of the WorkingDayNumber can be easily computed using RELATED. The value for ShipDate, on the other hand, needs a slightly more complex DAX formula, since we need to search, inside the Calendar table, the value of WorkingDayNumber for the date that equals ShipDate. Here are the formulas:
- WorkingDayOrder = RELATED (Calendar[WorkingDayNumber])
- WorkingDayShip = CALCULATE (VALUES (Calendar[WorkingDayNumber]), Calendar[Date] = EARLIER (SalesOrderHeader[ShipDate]))
And now, the final result is simply computed by subtracting the WorkingDayShip from the WorkingDayOrder, which returns the number of working days that passed from the date of the order to the date of the shipment. Sounds easy? No, it is not very easy… yet it can be done and, after having studied it, you will find it easy. PowerPivot requires you to change your mind and think in the DAX way, roll up your sleeves and start studying!
This is just another example of what PowerPivot can do for your reporting needs. If you want to touch the real Karma of PowerPivot, don’t miss the opportunity to follow one of the workshops I and Marco Russo are bringing all over Europe in the next few months.
You can find more info on www.powerpivotworkshop.com. Hope to see you there!
Checks whether a condition is met, and returns one value if TRUE, and another value if FALSE.
IF ( <LogicalTest>, <ResultIfTrue> [, <ResultIfFalse>] )
Returns TRUE if any of the arguments are TRUE, and returns FALSE if all arguments are FALSE.
OR ( <Logical1>, <Logical2> )
Adds all the numbers in a column.
SUM ( <ColumnName> )
Evaluates an expression in a context modified by filters.
CALCULATE ( <Expression> [, <Filter> [, <Filter> [, … ] ] ] )
Returns the value in the column prior to the specified number of table scans (default is 1).
EARLIER ( <ColumnName> [, <Number>] )
When a column name is given, returns a single-column table of unique values. When a table name is given, returns a table with the same columns and all the rows of the table (including duplicates) with the additional blank row caused by an invalid relationship if present.
VALUES ( <TableNameOrColumnName> )