 Marco Russo
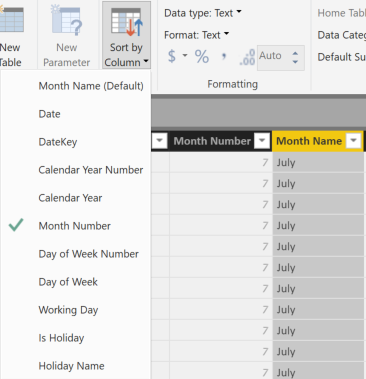
The Sort By Column feature sorts the values of a column using the values from another column. For example, a developer might want to display months by their name, in a sequence like January, February and March. To this end, it is necessary to apply the Sort By Column property to the Month Name column, indicating that the Month Number column must be used to define the sort order of month names. This avoids an alphabetical sort of the Month Name values.
This setting causes different side effects depending on the client used to query the model. For example, Power BI generates queries in DAX to populate a report, whereas an Excel PivotTable generates queries in MDX. The different languages used by the client tools might have an impact on the result of a measure defined in the model. The same measure might show different results in similar reports created using different tools. In order to understand why this happens and how to avoid these different results, it is necessary to know how MDX and DAX work.
Column sort order in DAX and MDX
A query in MDX automatically inherits the correct column sort order from the data model; the result of an MDX query is always sorted according to the Sort By Column setting. However, DAX does not have any implicit sort order for the columns other than the natural sort order of the underlying data type. For this reason, a DAX query must always specify the sort order in an ORDER BY condition – similarly to a query in SQL. Because DAX requires for a column used in ORDER BY to be part of the query result, a Power BI visual that sorts a column always generates a query that includes at least two columns: the column requested in the report and the underlying column used in the Sort By Column setting. In other words, a Power BI visual showing data by Month must generate a query that contains both Month Name and Month Number, whereas MDX only requires the Month Name column.
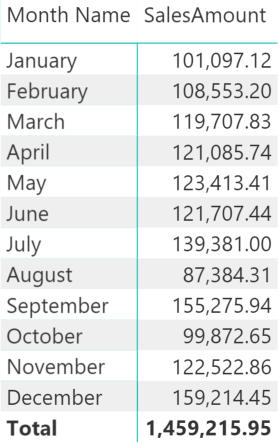
For example, consider the following report in Power BI.
The query generated by DAX is the following:
EVALUATE
TOPN (
    502,
    SUMMARIZECOLUMNS (
        ROLLUPADDISSUBTOTAL (
            ROLLUPGROUP (
                'Date'[Month Name],
                'Date'[Month Number]
            ), "IsGrandTotalRowTotal"
        ),
        "SalesAmount", 'Sales'[SalesAmount]
    ),
    [IsGrandTotalRowTotal], 0,
    'Date'[Month Number], 1,
    'Date'[Month Name], 1
)
ORDER BY
    [IsGrandTotalRowTotal] DESC,
    'Date'[Month Number],
    'Date'[Month Name]
Though the report only shows the Month Name, the DAX query includes both Month Name and Month Number. The result is correctly sorted by Month Number, indeed.
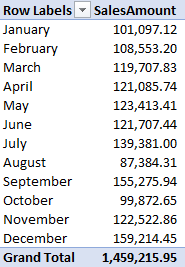
Now, consider the equivalent PivotTable in Excel connected to the same data model, for example using the Analyze In Excel feature at powerbi.com.
The query generated by MDX is the following:
SELECT
NON EMPTY
    Hierarchize(
        { DrilldownLevel(
            { [Date].[Month Name].[All] },
            ,,
            INCLUDE_CALC_MEMBERS
        ) }
    )
    DIMENSION PROPERTIES
        PARENT_UNIQUE_NAME,
        HIERARCHY_UNIQUE_NAME
    ON COLUMNS
FROM [Model]
The MDX query only includes the Month Name. It is not necessary to specify the Month Number, because MDX guarantees that the Month Name attribute is already sorted by Month Number in the result.
Side effects of Sort By Column in DAX queries
The presence of the two columns also causes side effects on the filter context. For example, consider the following measures:
FilterMonthName :=
ISFILTERED ( 'Date'[Month Name] )

FilterMonthNumber :=
ISFILTERED ( 'Date'[Month Number] )

Wrong % Months :=
DIVIDE (
    [SalesAmount],
    CALCULATE (
        [SalesAmount],
        ALL ( 'Date'[Month Name] )
    )
)
By comparing the results of similar reports in both Power BI and Excel it is possible to notice several differences.
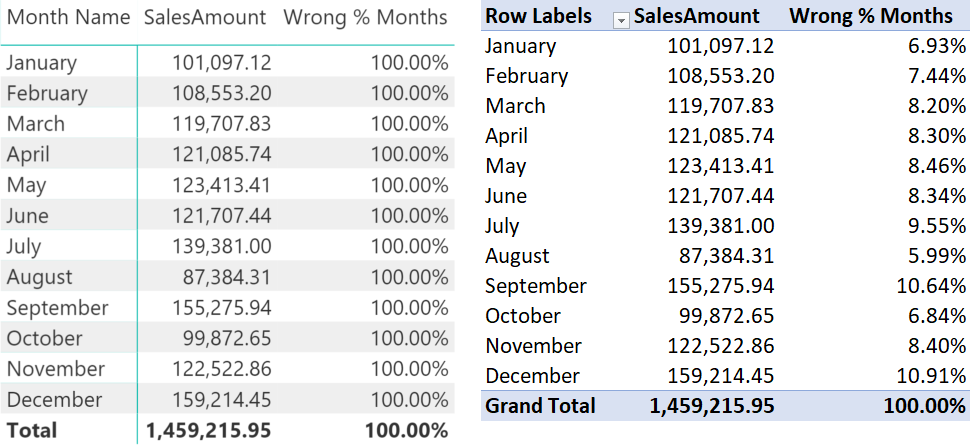
The Wrong % Months measure does not work in Power BI (left side) as it always returns 100%, whereas it works correctly in Excel (right side).
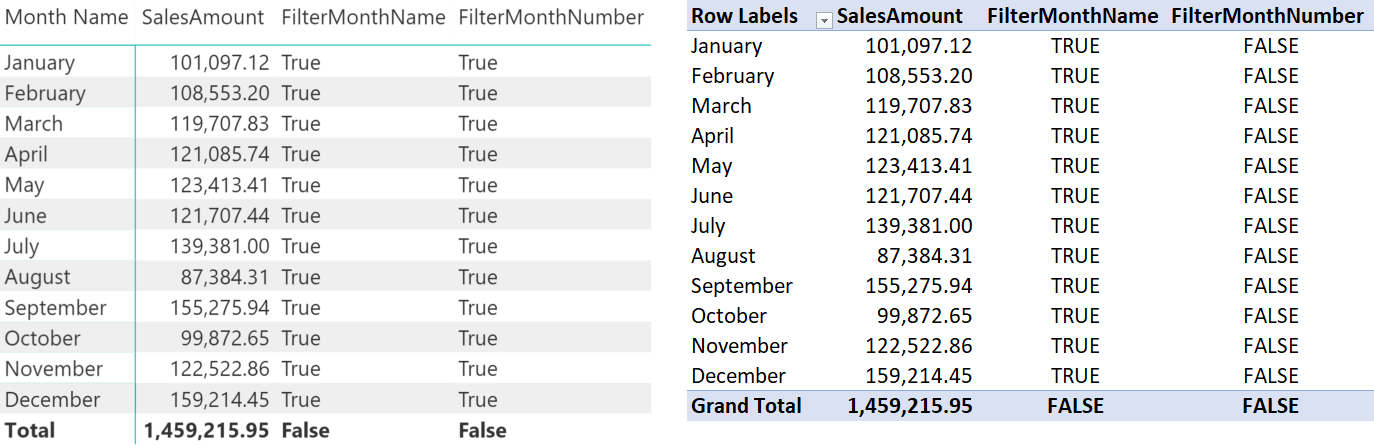
Moreover, the ISFILTERED function provides different results for the FilterMonthNumber column in the two clients: Power BI always returns TRUE when a Month Name is selected (left side), whereas Excel returns FALSE in a similar report. The reason is that DAX includes both columns in the query – this generates a different filter context to evaluate the measures compared to the one generated by MDX.
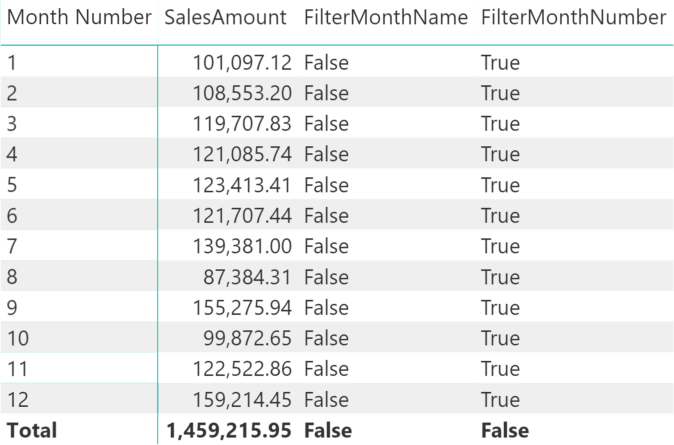
Finally, when a report uses the Month Number column without Month Name, the presence of Sort By Column on Month Name does not cause any side effects. The following Power BI report shows that only the FilterMonthNumber measure returns TRUE when the Month Number is used in the rows of a matrix, without affecting the FilterMonthName measure.
Golden rules for measures using Sort By Column
In order for a measure that manipulates a column with a Sort By Column setting to act predictably, it is better to always include the two columns involved in the Sort By Column setting whenever a filter is removed or manipulated.
Thus, instead of writing a filter test over a single column:
ISFILTERED ( 'Date'[Month] )
ISFILTERED ( 'Date'[Month Number] )
It is better to write a single expression including the two columns, such as:
ISFILTERED ( 'Date'[Month] ) || ISFILTERED ( 'Date'[Month Number] )
Whenever there is a filter removal over a single column:
ALL ( 'Date'[Month] )
ALL ( 'Date'[Month Number] )
It is better to write a single filter including both columns:
ALL ( 'Date'[Month], 'Date'[Month Number] )
Rewritten as per these best practices, the previous percentage measure appears as follows:
Correct % Months :=
DIVIDE (
    [SalesAmount],
    CALCULATE (
        [SalesAmount],
        ALL ( 'Date'[Month Name], 'Date'[Month Number] )
    )
)
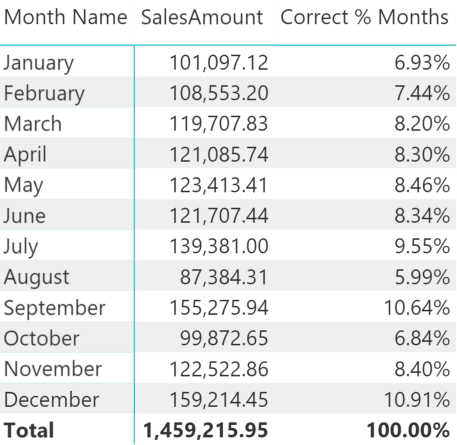
The Power BI report using this last measure shows the correct percentage by month when Month Name is used in the matrix rows.
Conclusions
When a DAX expression removes a filter from a column that has the Sort By Column setting active, it is a best practice to always include both columns in the ALL function. In order to test whether a column is filtered, it is a best practice to include two ISFILTERED functions in an OR condition, testing both columns involved in the Sort By Column setting.
Returns true when there are direct filters on the specified column.
ISFILTERED ( <TableNameOrColumnName> )
Returns all the rows in a table, or all the values in a column, ignoring any filters that might have been applied.
ALL ( [<TableNameOrColumnName>] [, <ColumnName> [, <ColumnName> [, … ] ] ] )
Returns TRUE if any of the arguments are TRUE, and returns FALSE if all arguments are FALSE.
OR ( <Logical1>, <Logical2> )