 Marco Russo
UPDATE 2017-02-01: The SUMMARIZECOLUMNS function is still not fully supported in a modified filter context. For example, it cannot be used within a measure in an expression of ADDCOLUMNS. Please, evaluate whether SUMMARIZECOLUMNS can work in all the conditions you want to support before using it in a measure.
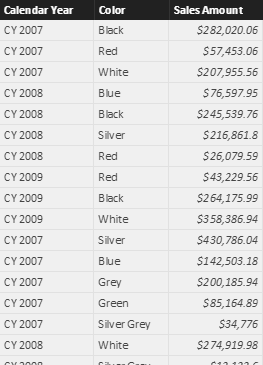
The historical DAX function that aggregates and group data leveraging existing relationships is SUMMARIZE. Such a function requires a table in the first argument, which corresponds to the table that is grouped. You can include columns in other related tables, if one or more many-to-one relationships exist to reach the referenced tables. For example, you can write the following syntax to retrieve a table with year, color, and sales amount:
Sales by Year and Color =
SUMMARIZE (
    Sales,
    'Date'[Calendar Year],
    'Product'[Color],
    "Sales Amount", SUMX ( Sales, Sales[Quantity] * Sales[Unit Price] )
)
Such a query returns a table, which is visible as a calculated table in the Power BI example you can download.
The problem of SUMMARIZE is that it has several pitfalls and performance issues, and for compatibility issues it cannot be fully fixed by Microsoft. For this reason, you should never write the former code. Instead, you should use SUMMARIZE only to obtain the list of unique years and colors for which there is at least a row in the Sales table, adding any aggregation expression using ADDCOLUMNS, as in the following example (you can find more details in the Best practices using SUMMARIZE and ADDCOLUMNS article):
Sales by Year and Color optimized =
ADDCOLUMNS (
    SUMMARIZE (
        Sales,
        'Date'[Calendar Year],
        'Product'[Color]
    ),
    "Sales Amount", CALCULATE ( SUMX ( Sales, Sales[Quantity] * Sales[Unit Price] ) )
)
Please, note that with ADDCOLUMNS you must add a CALCULATE statement to apply a context transition, whereas this is not required in SUMMARIZE.
If you use Power BI, Analysis Services 2016, or Excel 2016(*), you can use a new DAX function called SUMMARIZECOLUMNS, which apparently is just a replacement of SUMMARIZE. In reality, it provides some additional features. The initial SUMMARIZE syntax can be written using SUMMARIZECOLUMNS without specifying the table to group, as in the following example:
Sales by Year and Color new style =
SUMMARIZECOLUMNS (
    'Date'[Calendar Year],
    'Product'[Color],
    "Sales Amount", SUMX ( Sales, Sales[Quantity] * Sales[Unit Price] )
)
As you see, you no longer specify the Sales table in the SUMMARIZECOLUMNS arguments. Why this? You can imagine that SUMMARIZECOLUMNS is a very optimized version of the following code:
Sales by Year and Color using Crossjoin =
FILTER (
    SUMMARIZE (
        CROSSJOIN (
            VALUES ( 'Date'[Calendar Year] ),
            VALUES ( 'Product'[Color] )
        ),
        'Date'[Calendar Year],
        'Product'[Color],
        "Sales Amount", SUMX ( Sales, Sales[Quantity] * Sales[Unit Price] )
    ),
    NOT ( ISBLANK ( [Sales Amount] ) )
)
If you compare the query plans of the two versions using DAX Studio, you will notice that the SUMMARIZECOLUMNS is extremely efficient, requiring just one storage engine query and a smaller number of steps in the physical query plan.
In general, you should be able to replace SUMMARIZE with SUMMARIZECOLUMNS, also removing the twin ADDCOLUMNS/SUMMARIZE that you should have used for performance reasons so far. As a rule, we suggest to replace ADDCOLUMNS/SUMMARIZE and SUMMARIZE with SUMMARIZECOLUMNS, because the resulting query plan is more efficient. However, there are a few details that you should consider.
Filter table in SUMMARIZECOLUMNS
The SUMMARIZECOLUMNS version does not have the first argument specifying the base table to use for the join operation. In the previous examples, the DAX engine infers such a table from the aggregation expression we applied for Sales Amount, producing an equivalent result. However, if you do not include any expression, you obtain a crossjoin as a result. For example, consider the following syntax:
Sales by Year and Color crossjoin implicit =
SUMMARIZECOLUMNS (
    'Date'[Calendar Year],
    'Product'[Color]
)
It produces all the possible combinations between year and color, which are 112 in our example (7 years multiplied by 16 colors), and it corresponds to the following query:
Sales by Year and Color crossjoin explicit =
CROSSJOIN (
    VALUES ( 'Date'[Calendar Year] ),
    VALUES ( 'Product'[Color] )
)
What is the equivalent syntax of this SUMMARIZE that returns only the existing 47 combinations of year and color used by at least one row of the Sales table? It is the following one:
Sales by Year and Color summarize =
SUMMARIZE (
    Sales,
    'Date'[Calendar Year],
    'Product'[Color]
)
You must specify the optional filter table argument after the columns you aggregate, and before any additional calculated column (not present in this case):
Sales by Year and Color summarizecolumns =
SUMMARIZECOLUMNS (
    'Date'[Calendar Year],
    'Product'[Color],
    Sales
)
In SUMMARIZECOLUMNS you can add multiple filter tables, which could be useful for queries applied to complex data models with multiple fact tables.
There are no differences in the query plans produced by SUMMARIZECOLUMNS and SUMMARIZE for these last examples. Thus, it is not required to replace SUMMARIZE with SUMMARIZECOLUMNS if you do not compute expressions in SUMMARIZE.
Row context missing in SUMMARIZECOLUMNS
Another difference between SUMMARIZE and SUMMARIZECOLUMNS is that SUMMARIZE keeps both a row context and a filter context active in the expression where you specify the aggregation (more details in All the secrets of SUMMARIZE), whereas SUMMARIZECOLUMNS provides a filter context only and no row context.
For example, you can write this expression using SUMMARIZE, where the year number is used to apply a correction to the sales amount value:
Sales by Year and Color correction summarize =
SUMMARIZE (
    Sales,
    'Date'[Calendar Year Number],
    'Product'[Color],
    "Sales Amount",
    VAR delta = 'Date'[Calendar Year Number] - 2007
    VAR correction = 1 + ( delta / 100 )
    RETURN
        correction
            * SUMX ( Sales, [Quantity] * Sales[Unit Price] )
)
Because with SUMMARIZECOLUMNS you do not have a row context to the columns you are grouping, you must use VALUES to retrieve such a value from the filter context, assuming you have only one value active if you are not evaluating the expression in a rollup:
Sales by Year and Color correction summarizecolumns =
SUMMARIZECOLUMNS (
    'Date'[Calendar Year Number],
    'Product'[Color],
    "Sales Amount",
    VAR delta = VALUES ( 'Date'[Calendar Year Number] ) - 2007
    VAR correction = 1 + ( delta / 100 )
    RETURN
        correction
            * SUMX ( Sales, [Quantity] * Sales[Unit Price] )
)
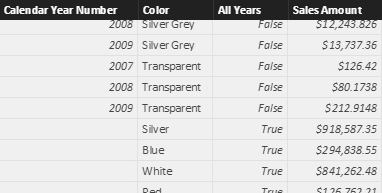
In case you have a rollup active in SUMMARIZECOLUMNS, then you must consider that there will be multiple values in the filter context. In this case, checking the presence of multiple values using HASONEVALUE is required before calling VALUES.
Sales by Year and Color correction summarizecolumns with subtotals =
SUMMARIZECOLUMNS (
    ROLLUPADDISSUBTOTAL ( 'Date'[Calendar Year Number], "All Years" ),
    'Product'[Color],
    "Sales Amount",
    VAR delta =
        IF (
            HASONEVALUE ( 'Date'[Calendar Year Number] ),
            VALUES ( 'Date'[Calendar Year Number] ) - 2007,
            0
        )
    VAR correction = 1 + ( delta / 100 )
    RETURN
        correction
            * SUMX ( Sales, [Quantity] * Sales[Unit Price] )
)
In the following screenshot you can see the additional column All Years, which contains True for additional rows containing the total of each color for all the years.
Versions supporting SUMMARIZECOLUMNS
You should consider which version of products adopting DAX as a language can support SUMMARIZECOLUMNS:
- Excel 2010: not supported
- Excel 2013: not supported
- Excel 2016: supported only without an external filter context (*)
- Analysis Services 2012: not supported
- Analysis Services 2014: not supported
- Analysis Services 2016: supported
- Power BI Desktop: supported
(*) In Excel 2016 you cannot apply an external filter context (e.g. CALCULATE or CALCULATETABLE ) to SUMMARIZECOLUMNS, so you cannot use it in a measure expression. This was a limitation in former builds of Power BI and Analysis Services 2016, but they are supported in January 2017 version of Power BI and Service Pack 1 of Analysis Services 2016. Hopefully, future versions of Excel will remove this limitation, making it possible to use SUMMARIZECOLUMNS in measures, too.
Conclusion
You should consider the SUMMARIZE function almost like a deprecated one. The only safe use of SUMMARIZE is when you do not include additional expressions, and you use SUMMARIZE only to join tables and obtain a result equivalent to a SELECT DISTINCT in SQL language.
The SUMMARIZECOLUMNS function produces a very optimized query plan, and you should consider it as a replacement to SUMMARIZE and ADDCOLUMNS/SUMMARIZE pattern.
Create a summary table for the requested totals over set of groups.
SUMMARIZECOLUMNS ( [<GroupBy_ColumnName> [, [<FilterTable>] [, [<Name>] [, [<Expression>] [, <GroupBy_ColumnName> [, [<FilterTable>] [, [<Name>] [, [<Expression>] [, … ] ] ] ] ] ] ] ] ] )
Returns a table with new columns specified by the DAX expressions.
ADDCOLUMNS ( <Table>, <Name>, <Expression> [, <Name>, <Expression> [, … ] ] )
Creates a summary of the input table grouped by the specified columns.
SUMMARIZE ( <Table> [, <GroupBy_ColumnName> [, [<Name>] [, [<Expression>] [, <GroupBy_ColumnName> [, [<Name>] [, [<Expression>] [, … ] ] ] ] ] ] ] )
Evaluates an expression in a context modified by filters.
CALCULATE ( <Expression> [, <Filter> [, <Filter> [, … ] ] ] )
When a column name is given, returns a single-column table of unique values. When a table name is given, returns a table with the same columns and all the rows of the table (including duplicates) with the additional blank row caused by an invalid relationship if present.
VALUES ( <TableNameOrColumnName> )
Returns true when there’s only one value in the specified column.
HASONEVALUE ( <ColumnName> )
Evaluates a table expression in a context modified by filters.
CALCULATETABLE ( <Table> [, <Filter> [, <Filter> [, … ] ] ] )
Returns a one column table that contains the distinct (unique) values in a column, for a column argument. Or multiple columns with distinct (unique) combination of values, for a table expression argument.
DISTINCT ( <ColumnNameOrTableExpr> )